Event Quality
The event quality application has a number of tools to review your seismic data and check for problems or anomalies. This is also a place where you can define what is a ‘quality' event that is used in every other app in the Seismic Suite.
Data
Seismic suite data
Key Learning Process
1. Event Quality Viewer
The Event Quality Viewer has a number of charts that plot seismic parameters over time and against one another. You can use these charts to look for obvious poor quality data and inconsistencies.
Embed Video: Event Quality Viewer
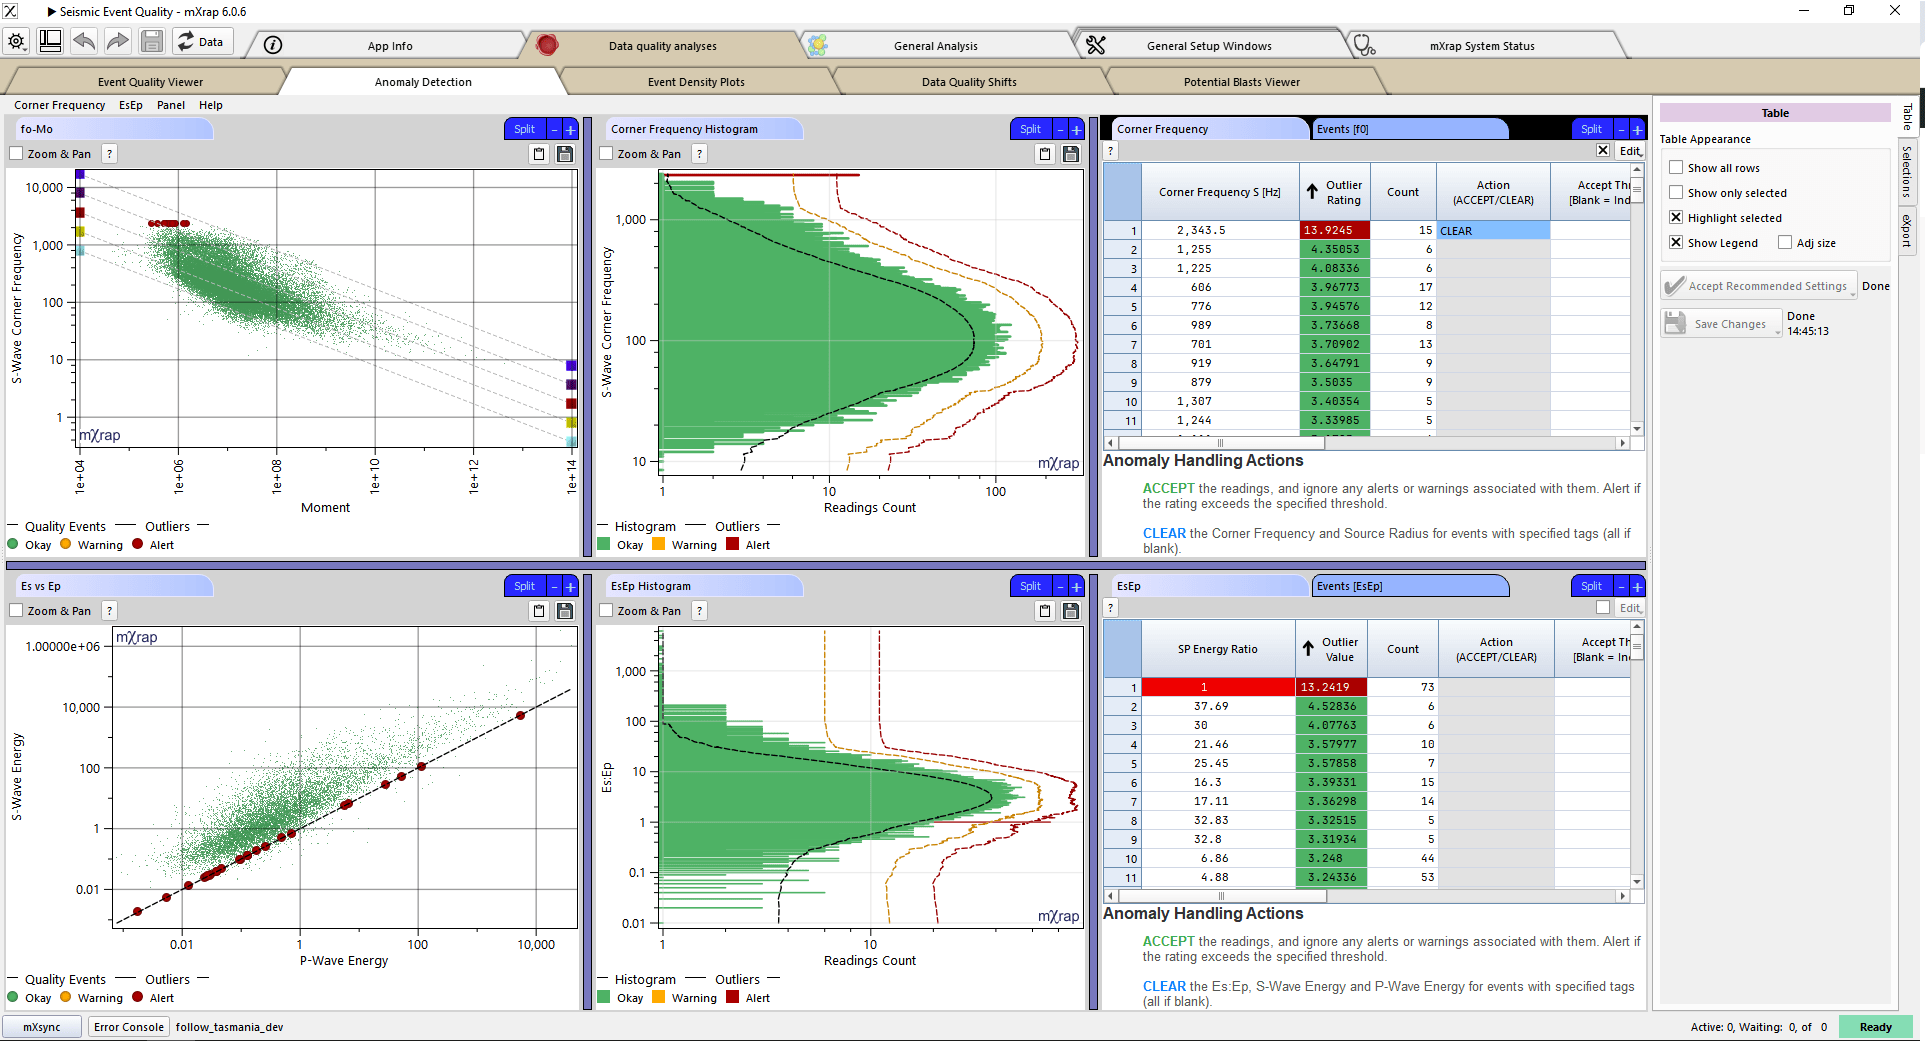
2. Anomaly Detection
The anomaly detection window assesses the seismic database for problems with the Energy S:P Ratio and the Corner Frequency. The detector looks for many events with exactly the same parameters and highlights when the frequency is anomalous. The anomalies are listed in the table for action to be taken.
This window, located under the Data Quality Analyses section, is designed to help analyse your seismic event database and identify any anomalies in the frequency of readings for certain seismic parameters. Currently, the tool is focused on identifying issues with the S-Wave Corner Frequency and S-P Energy Ratio.
Anomalies often stem from default values, null entries, manual input or rounding mistakes. While many of these anomalies indicate bad data, not all do. However, if any data is found to be incorrect, it's important to clear these values to prevent skewing your analysis. The Anomaly Detection window provides visualisation tools to help you investigate any flagged anomalies and take appropriate action.
When an anomaly exceeds the alert threshold, you will receive an alert upon opening the Seismic Event Quality app. From there, you have the option to:
- Ignore the alert,
- Accept the recommended settings, or
- Open the Anomaly Detection window for further investigation.

The recommended settings will clear any flagged values from the database.
Within the Anomaly Detection window, you can choose to either ACCEPT or CLEAR the flagged readings:
- ACCEPT: Set a threshold for when the alert should re-trigger (optional).
- CLEAR: Specify which event tags the clearing applies to (optional).
When you choose to CLEAR, this will also clear any derived parameters associated with the source parameter.
For example:
- Clearing the S-Wave Corner Frequency will also clear the Source Radius.
- Clearing the S-P Energy Ratio will also clear the S-Wave Energy and P-Wave Energy.
Remember to click the "Save Changes" button on the right-hand side to save any modifications.
Events highlighted in orange indicate that they have exceeded the warning threshold but have not yet reached the alert threshold.
3. Event Density Plots
The event density plots are a way of seeing abnormal densities in parameter spaces. There are charts for:
- Energy vs. Moment
- Corner Frequency vs. Energy
- Corner Frequency vs. Moment
4. Data Quality Shifts
This window assesses a number of seismic parameters over time and searches for step-changes in their typical ranges. These may indicate changes in the seismic processing algorithm over time that have not been applied to the whole database.
5. Potential Blasts Viewer
The potential blasts viewer uses a number of techniques to flag a potential blast if it meets all of the criteria. The criteria are:
- Occurs during shift change-over period
- High static stress drop
- Within magnitude range
- Above a minimum energy
- Above a minimum moment
6. Event Quality Settings
This window has a number of settings that control the event quality filter that is used in every app in the Seismic Suite. To pass the quality filter, events must be: Within a certain date range Within a 3D bounding box Have a valid location Within a certain magnitude range Have at least a certain number of sensors used
7. Event Tags Editor
This is the window for setting event tags. Selections from other windows will appear here and you can assign a tag to them. You can also define the meaning of user tags and imported tags for the quality filter.
Authors
Principal: Izak Morkel Contributing: Liam Niedzielski, Stuart Tierney
Citation
Morkel, IG, Niedzielski, L, & Tierney, S 2024, mXrap software app, Mine Seismicity - Seismic Event Quality, Australian Centre for Geomechanics, Perth, https://mxrap.com/
Publications
Morkel, IG & Wesseloo, J 2017, 'A technique to determine systematic shifts in microseismic databases', Proceedings of the Eighth International Conference on Deep and High Stress Mining, Australian Centre for Geomechanics, Perth, https://papers.acg.uwa.edu.au/p/1704_05_Morkel/
Morkel, IG & Wesseloo, J 2017, 'The effect of sensor frequency range on the estimation of the current hazard state', in JA Vallejos (ed.), Proceedings of the 9th International Symposium on Rockbursts and Seismicity in Mines, Universidad de Chile, Santiago.
Morkel, IG, Wesseloo, J & Harris, PC 2015, ‘Highlighting and quantifying seismic data quality concerns', in PM Dight (ed.), Ninth International Symposium on Field Measurements in Geomechanics, 9-11 September 2015, Sydney, New South Wales, Australia, Australian Centre for Geomechanics, pp. 215-222. https://doi.org/10.36487/ACG_rep/1508_37_Morkel