Per-Octree Analysis
Purpose
Assessment of performance on a per octree basis. This analysis used to identify correlations between stope performance and various parameters, for example, assessing the influence of blast energy on projected distance.
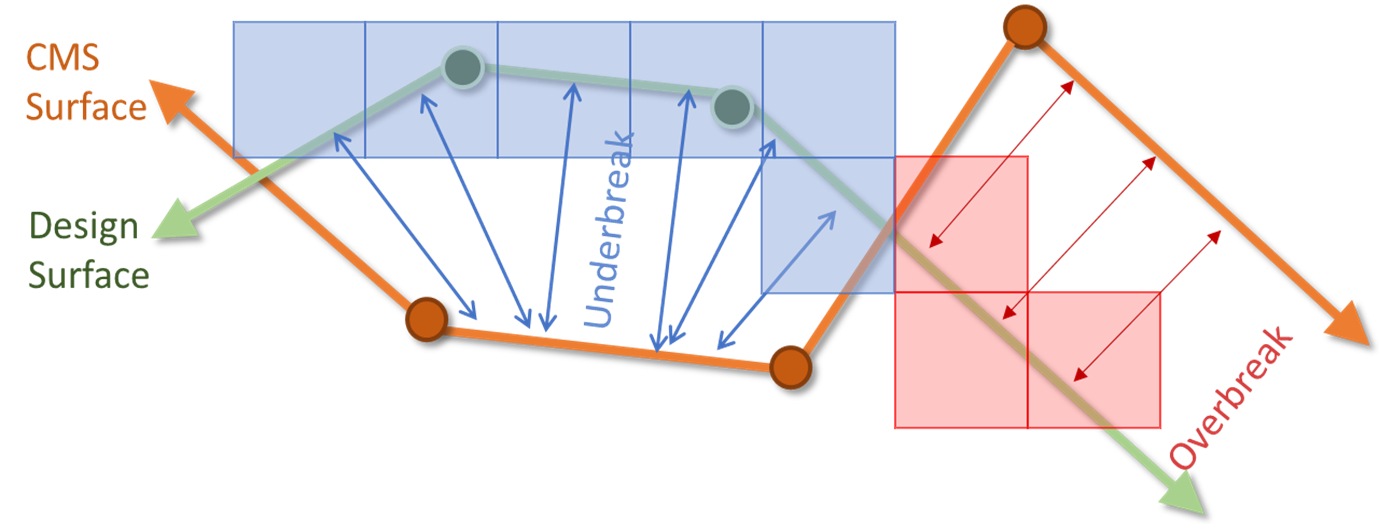
Per octree represents the new advancement in stope reconciliation and analysis by considering a yet finer resolution. Stope performance is quantified by calculating the distance in the direction normal to the design surface and a surface generated by a cavity monitoring system (CMS).
Analysis options consist of:
- 3D view
- Table view
- Charts:
- Cumulative Chart
- 3D Chart
- Vs charts
The VS charts plot the projected distance against parameters quantified on a per octree basis. These include:
- Blast energy, orientation and standoff
- Angle to development, Distance to development, and
- Site Specific Geotechnical Data e.g. UCS and RQD
- Dip of the octree orientation, ERF, and distance to convex hull which includes the stope design with development
- Various fault parameters e.g. distance to fault, relative difference in orientation.
- Group by chart - Plots the project distance for a parameter that has been split into groups depending on another parameter
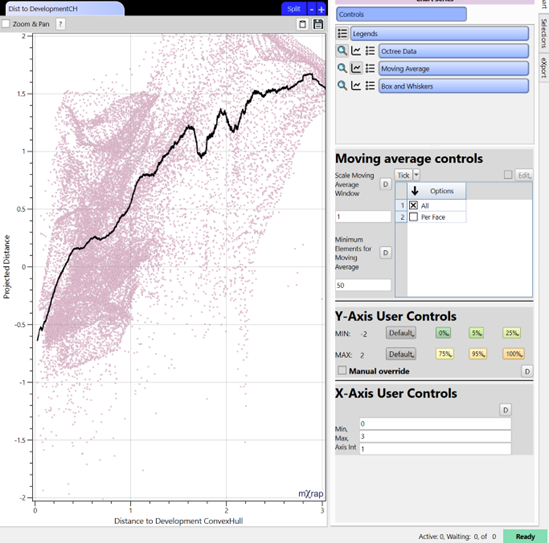
Moving averages (for all octree or per face) can be plotted for these charts as well as box and whisker plots. To change the width of the boxes, change the axis interval in the X axis user controls in the control panel.
Positive projected distance represents OB while negative projected distance represents UB.
Clusters of octrees can be selected in the chart view and will be highlighted in the 3D view. This is helpful when investigating outliers or data with interesting correlations.
Parameters
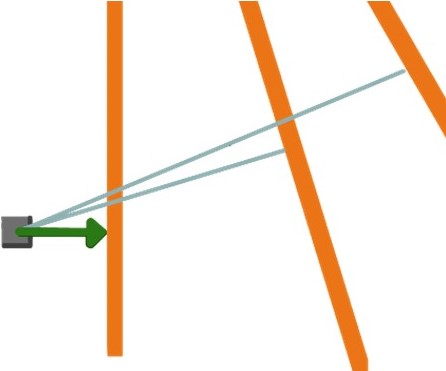
Blasthole standoff distance
Concept
Distance (coloured by meter) from an octree block to the nearest designed blasthole.
Interpretation
Blast-induced damage.
Characterises how OB and UB are affected by the standoff distance to the blastholes.
Example
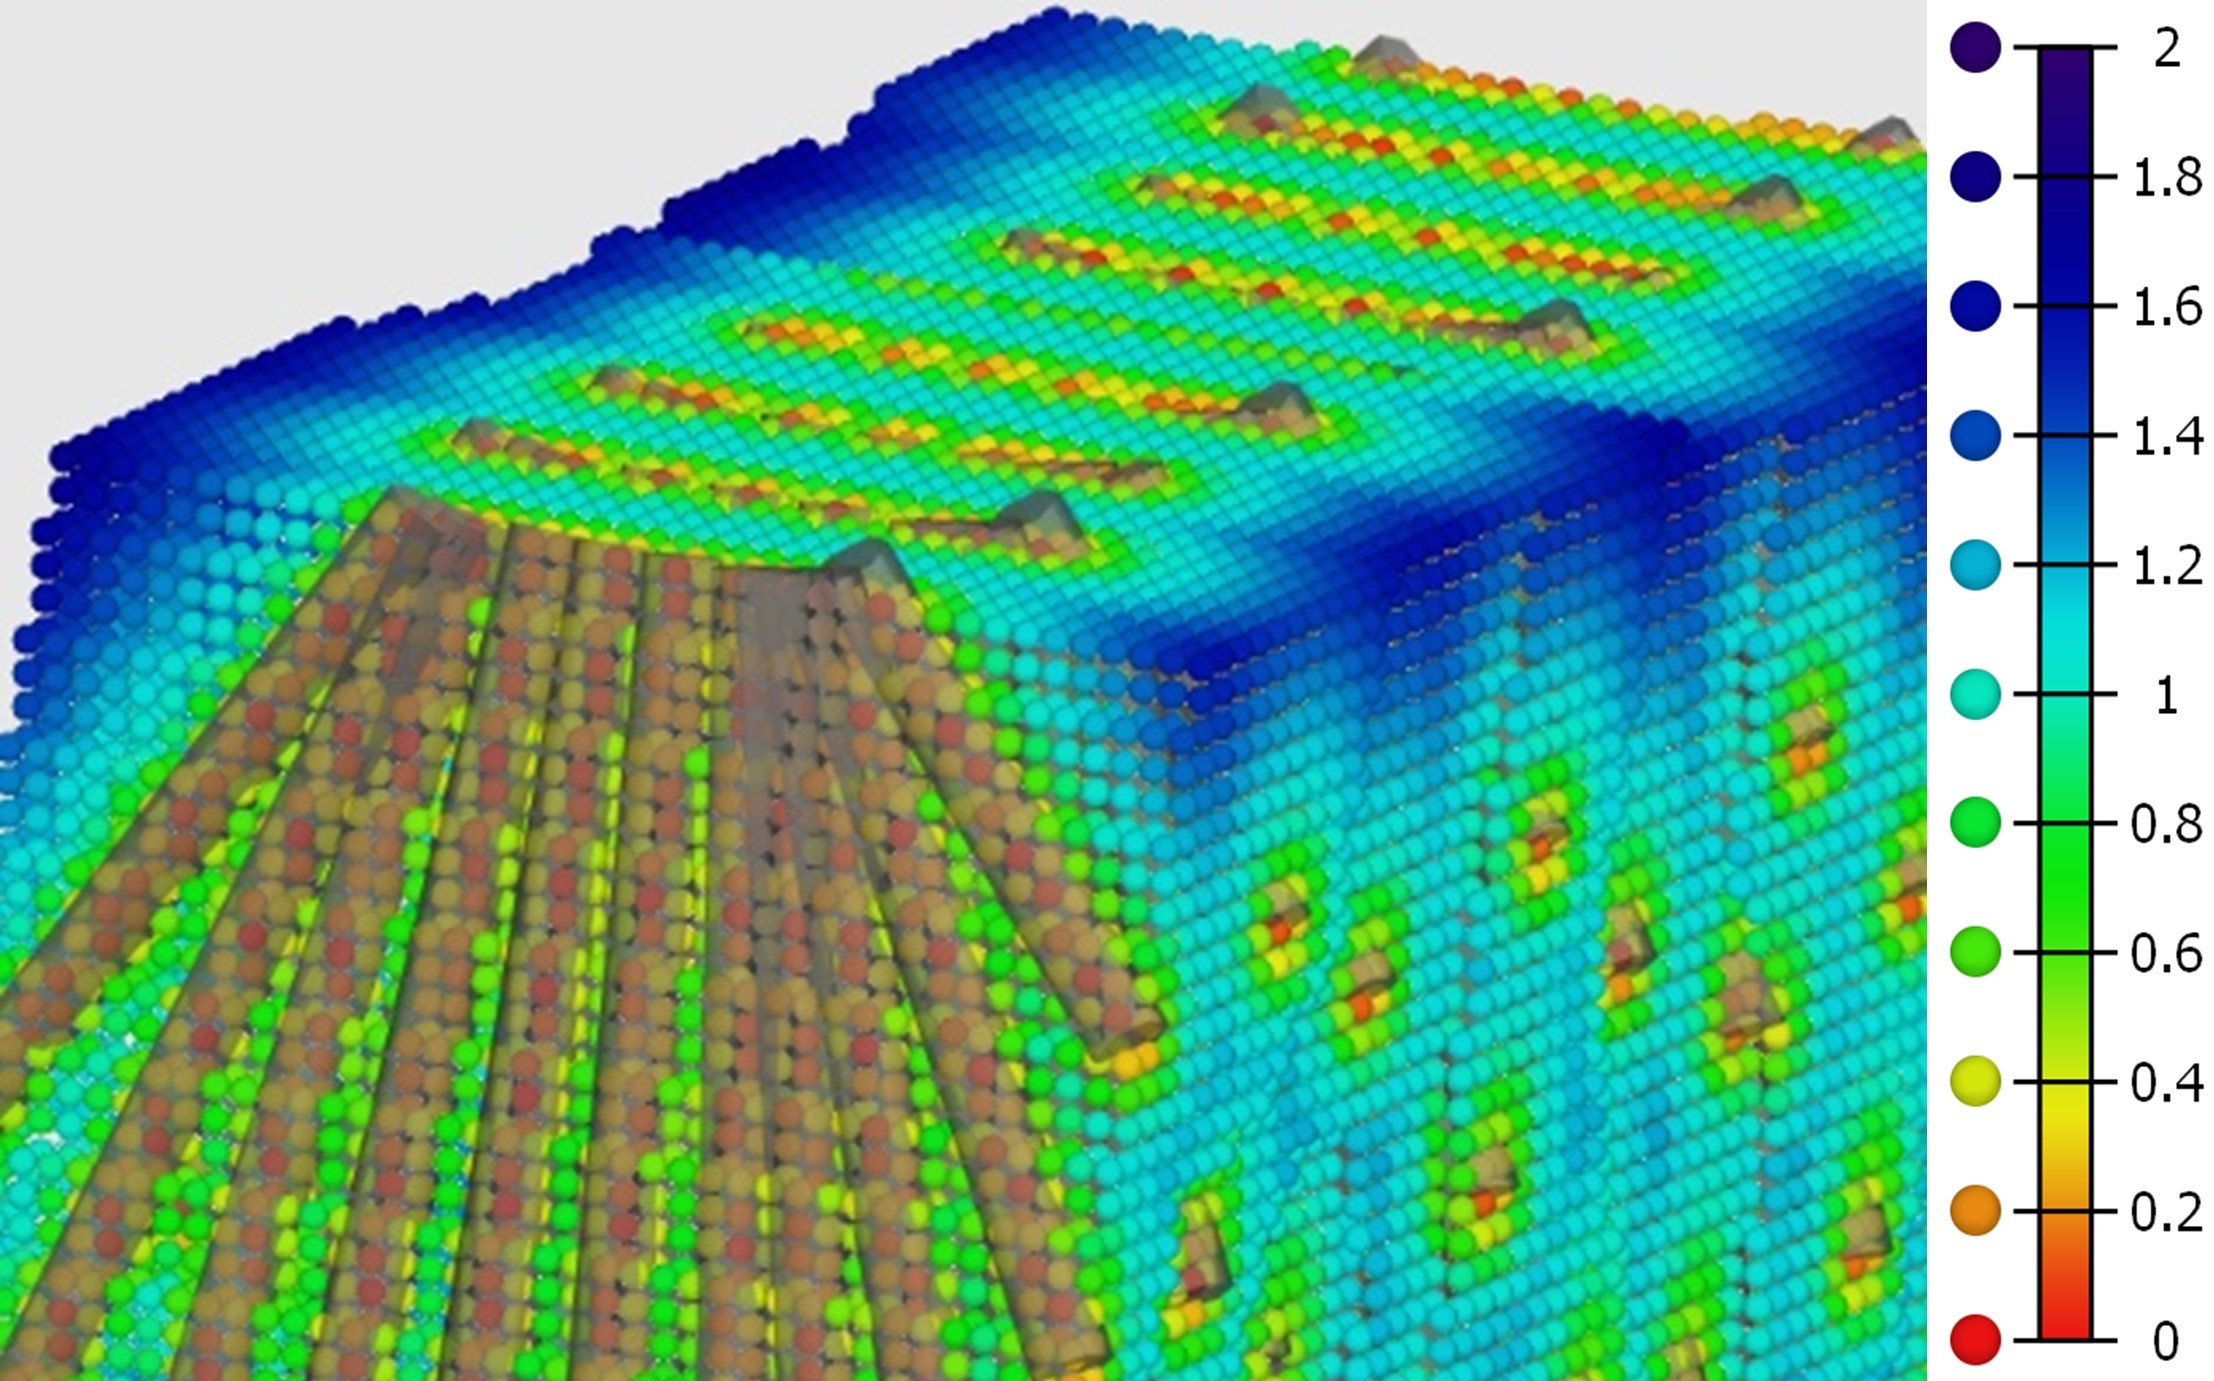
Distribution of the Distance for each octree along the design surface (dots in the image) to their nearest blasthole. Cold colours mean the octrees are further away from the blastholes and generally, UB is expected.
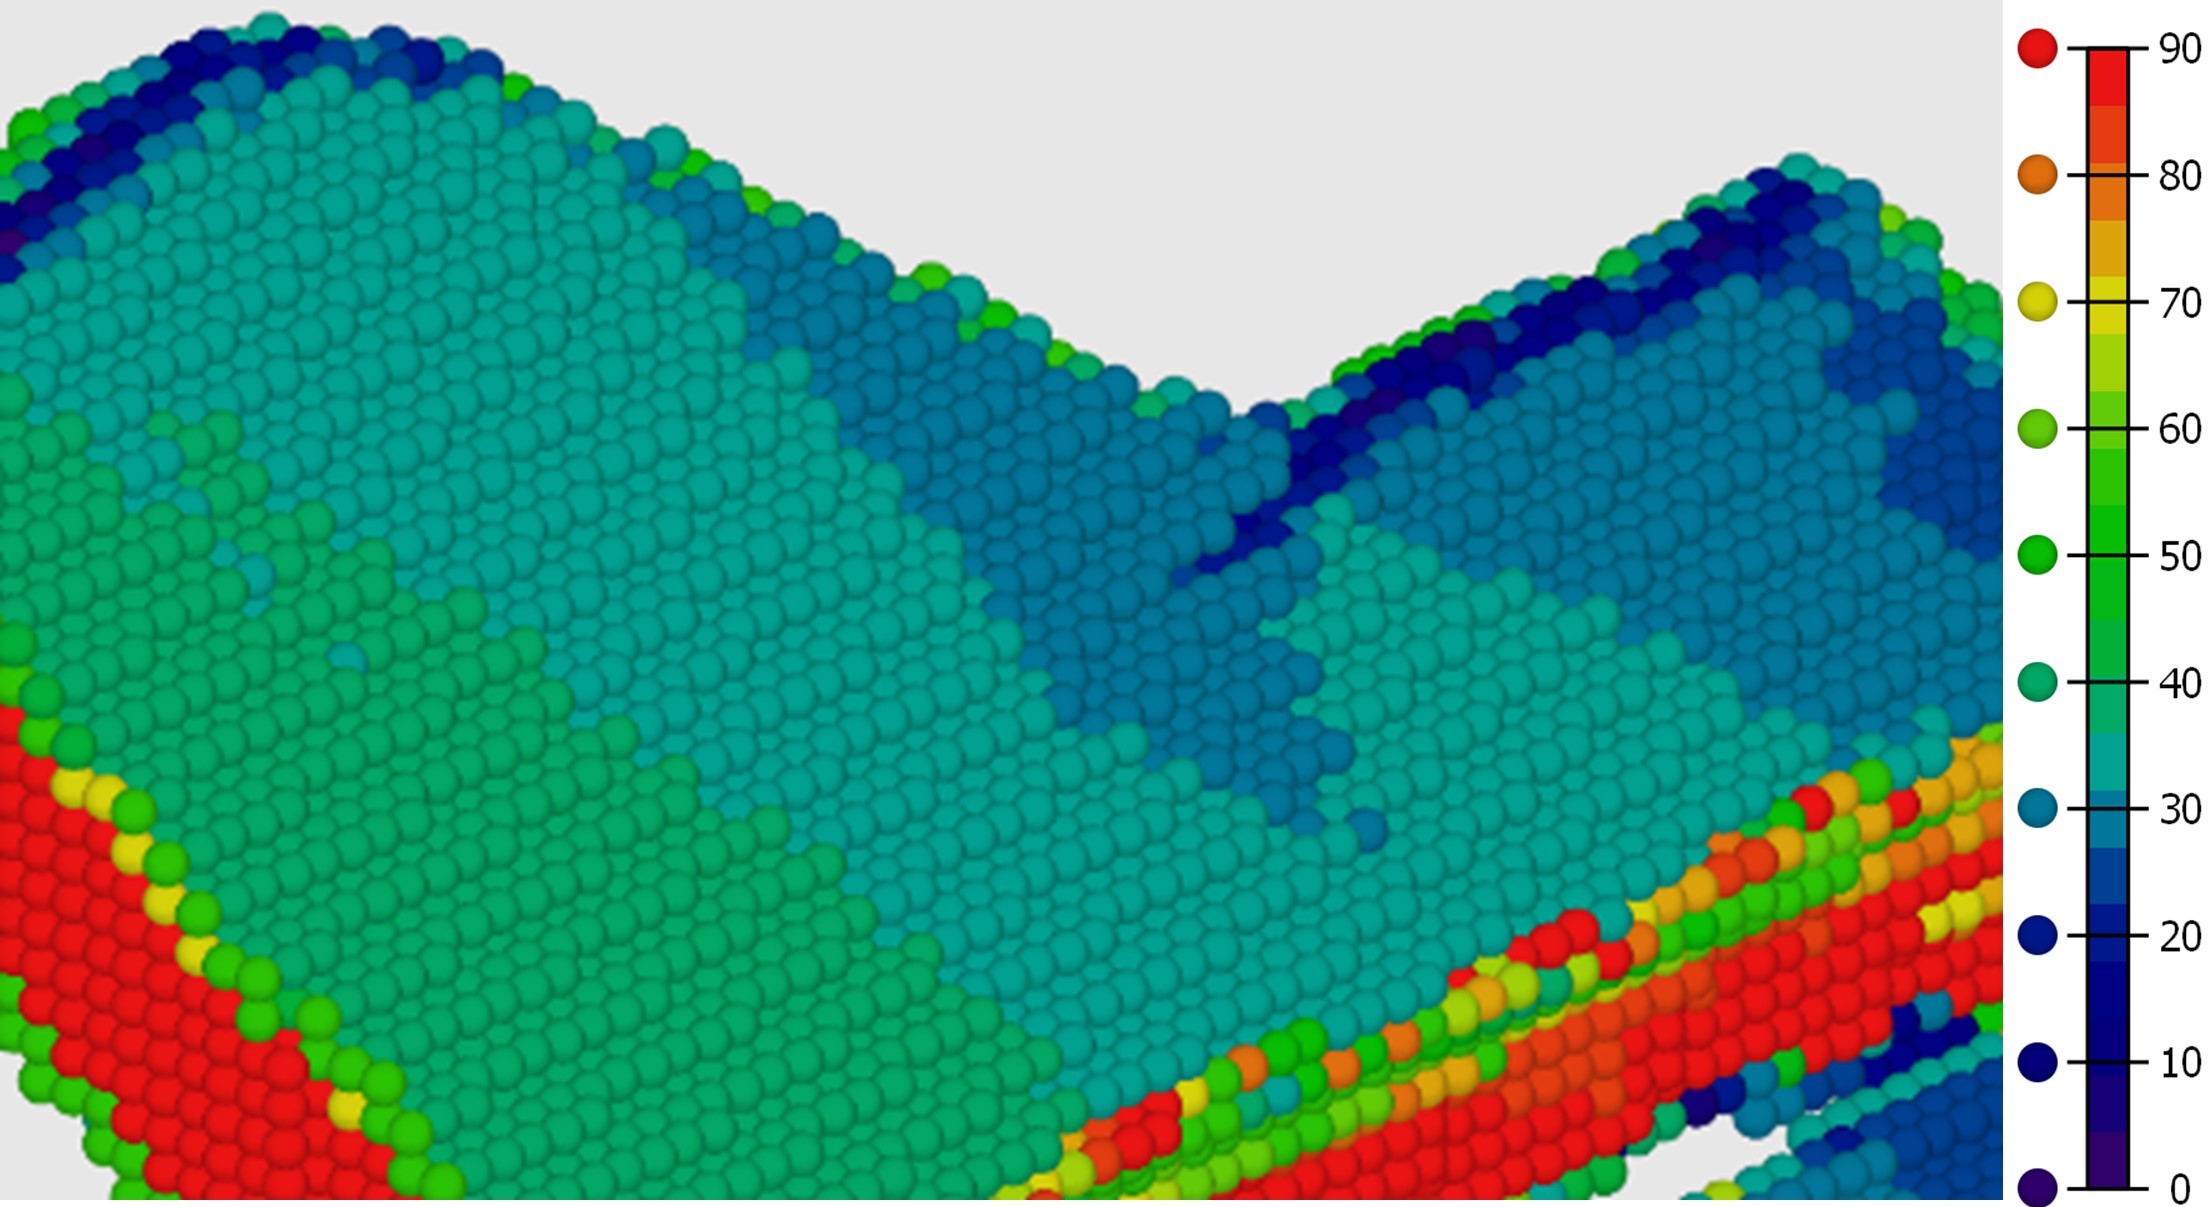
Blasthole orientation
Concept
Shortest angle (coloured by degree) between an octree's design normal vector and the blasthole. Convention: 90° = Toeing, 0° = Parallel.
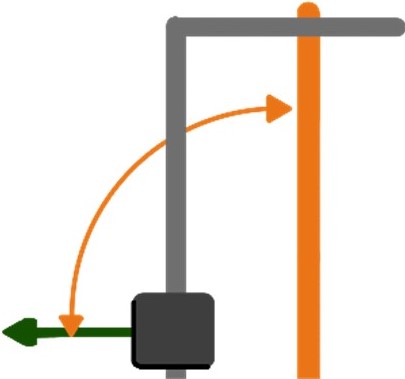
Interpretation
Blast-induced damage.
Characterises how OB and UB is affected by the angle of the blastholes to the design surface.
Example
Distribution of the angle for each octree along the design surface (dots in the image) to their nearest blasthole. Warm colours (90°) means the blastholes are toeing into the design surface.
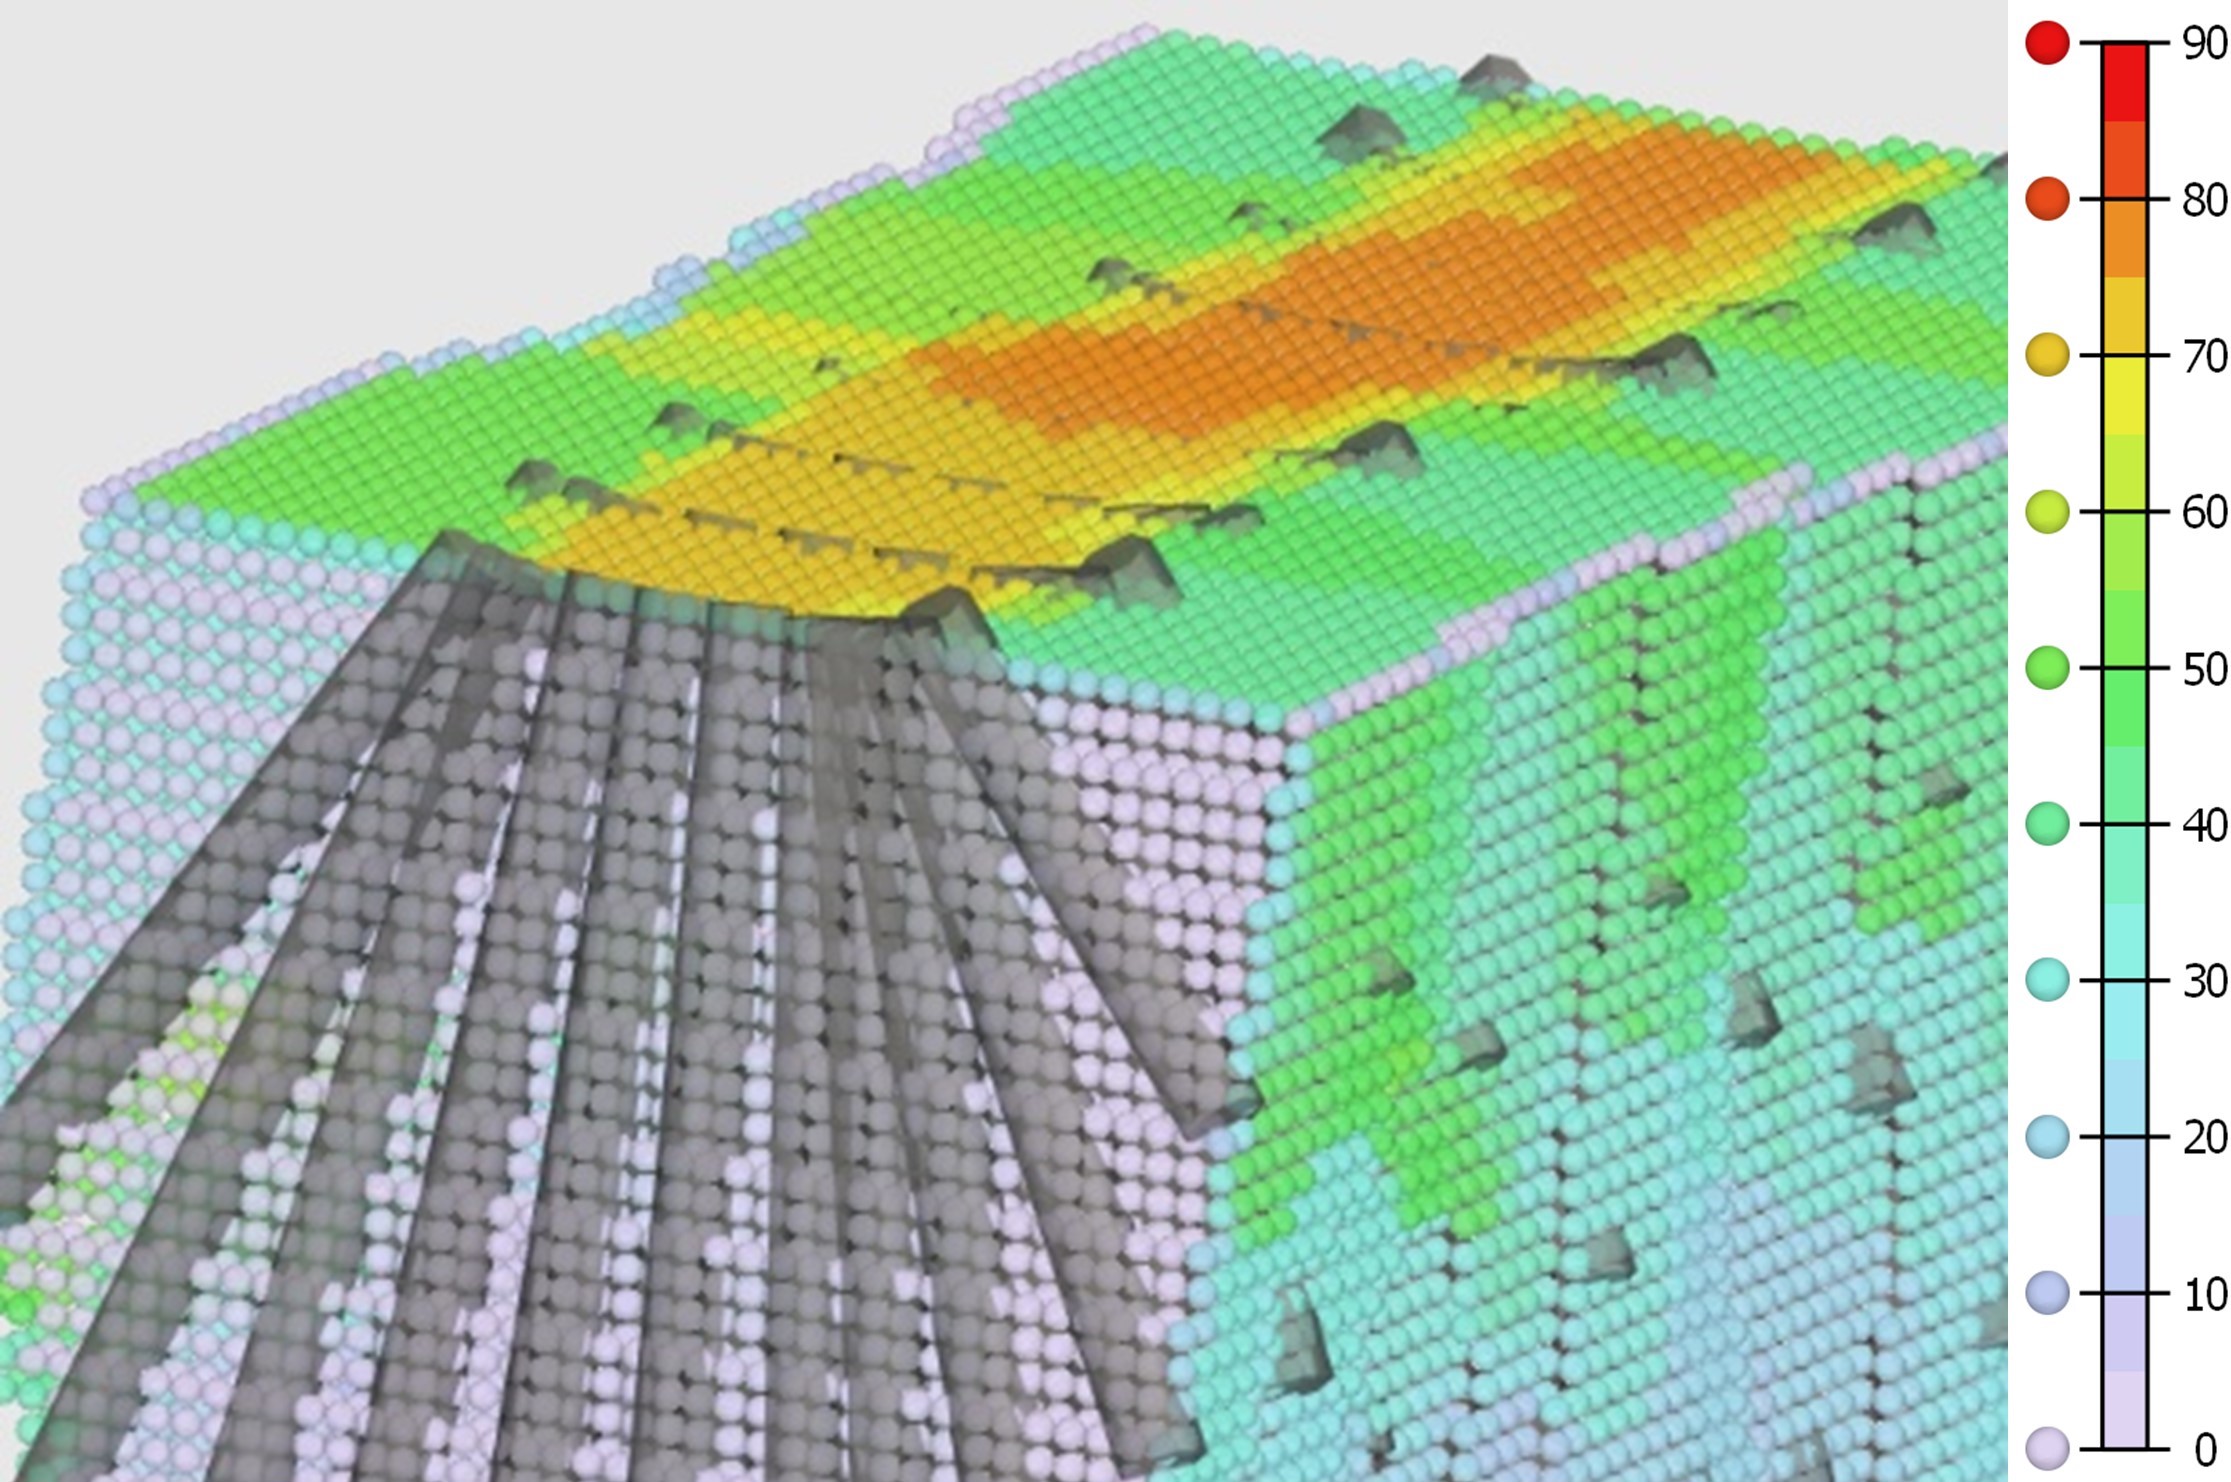
Proxy for the blast energy
Concept
where: L = Length of hole.
D = Distance to hole.
Max. distance of 0.5 m to account for stemming near collars (coloured by energy index).
Interpretation
Blast-induced damage.
Characterises how OB and UB are affected by the density of blastholes and the drill pattern.
Example
Distribution of the energy proxy for each octree along the design surface (dots in the image). The energy calculation considers the density of blastholes around the octree (inverse distance relationship) and the length of the blastholes to determine the spatial distribution of the blasting energy according to the blasthole design. Warm colours mean more energy is expected in that area due to the drill design.
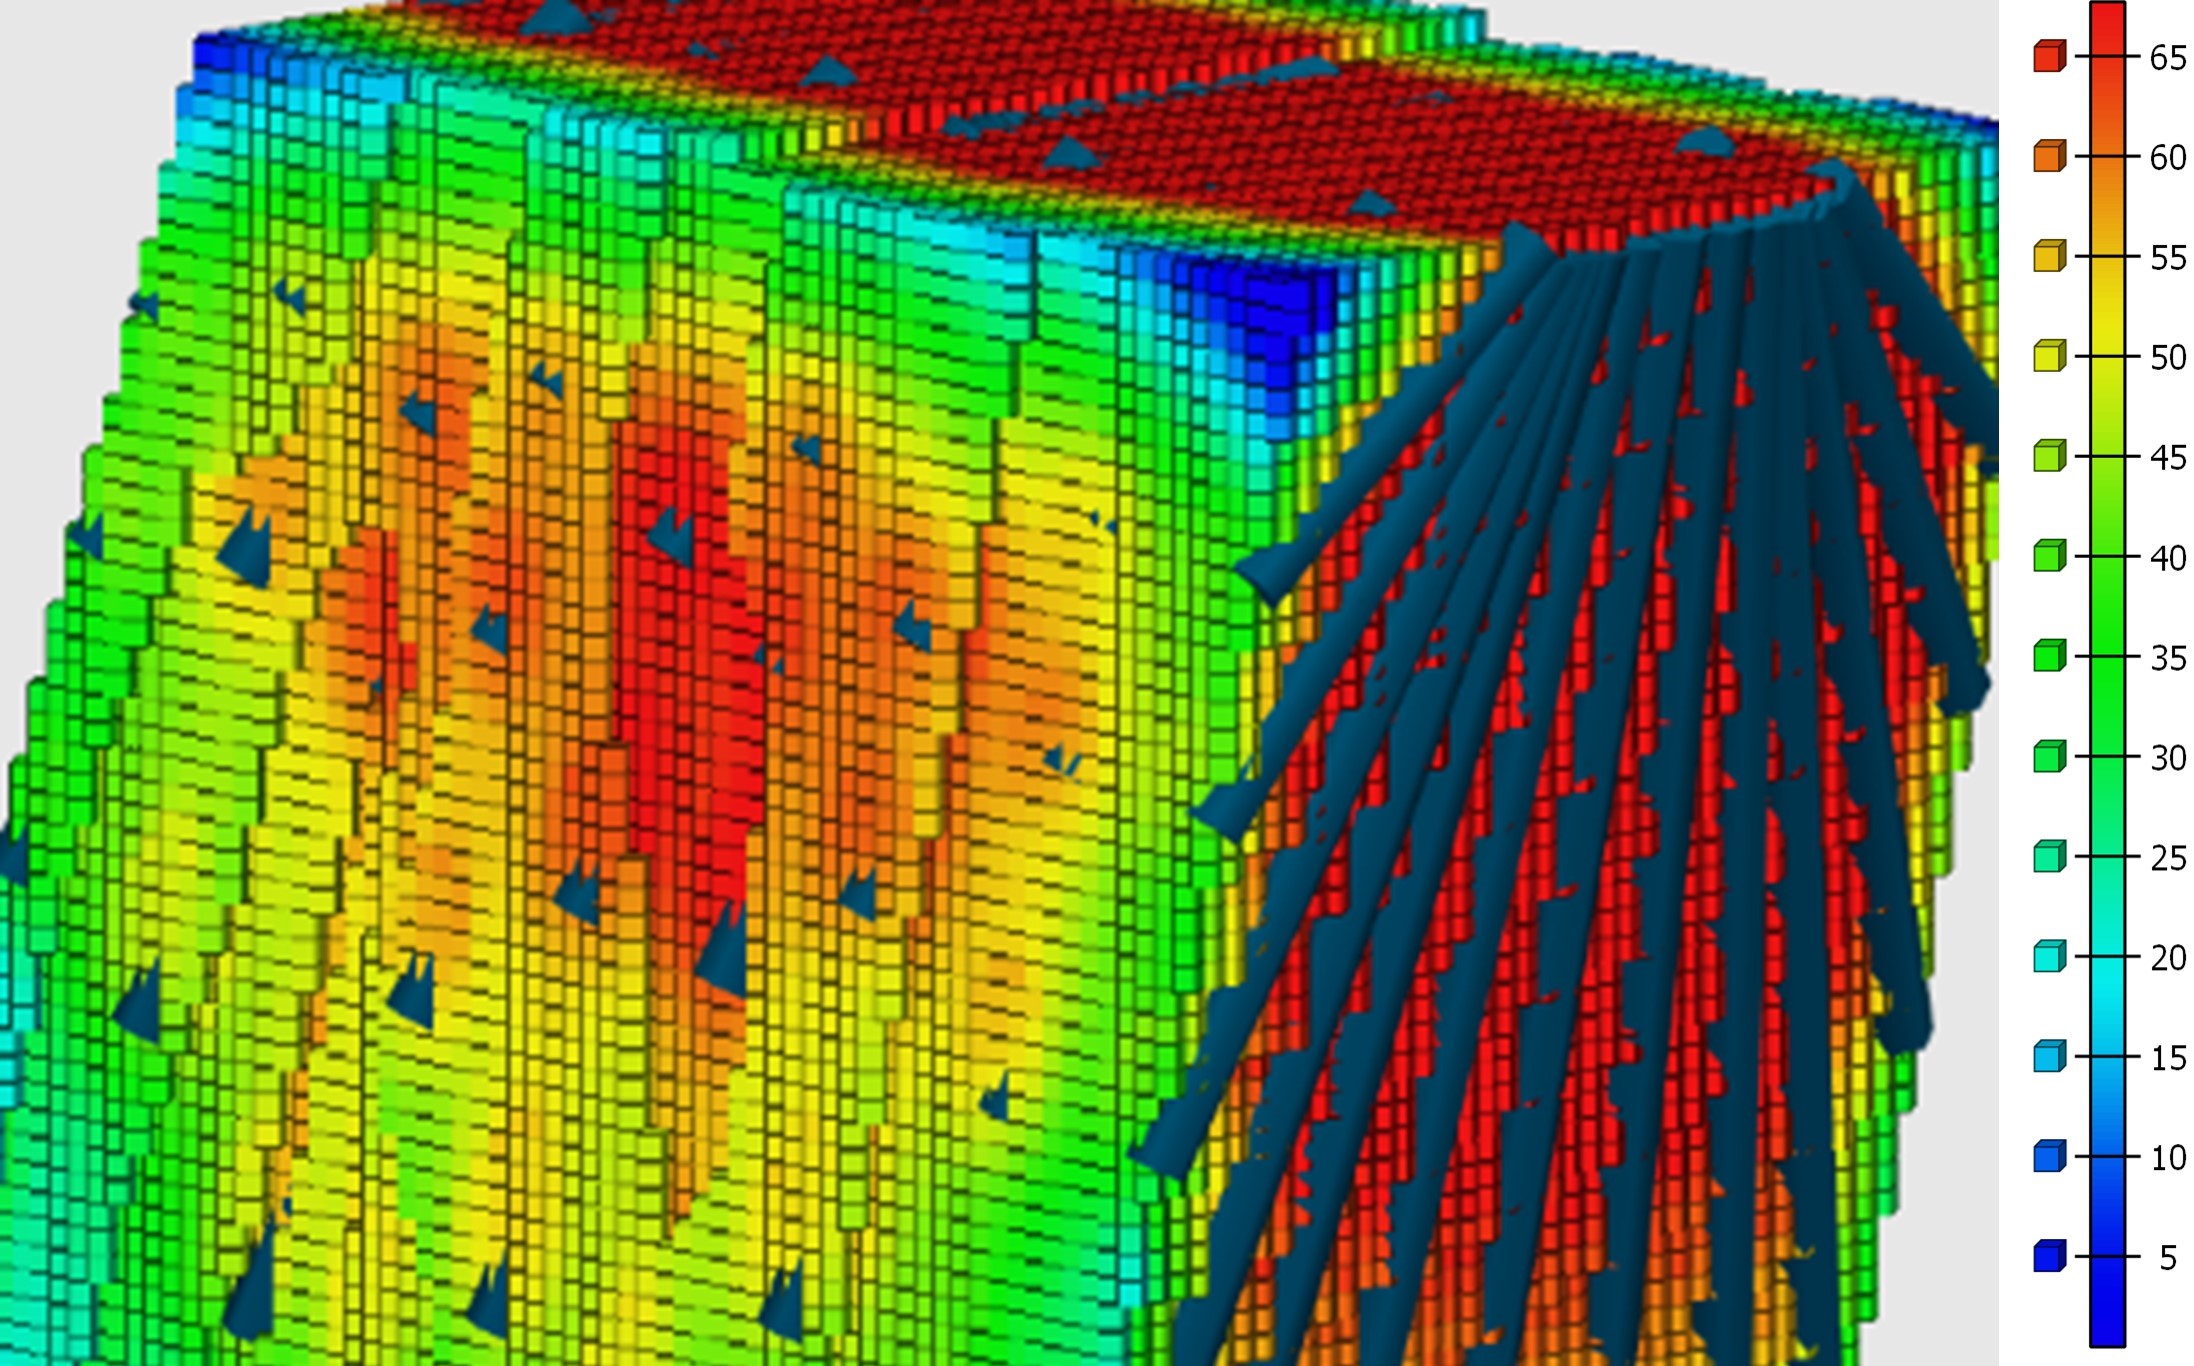
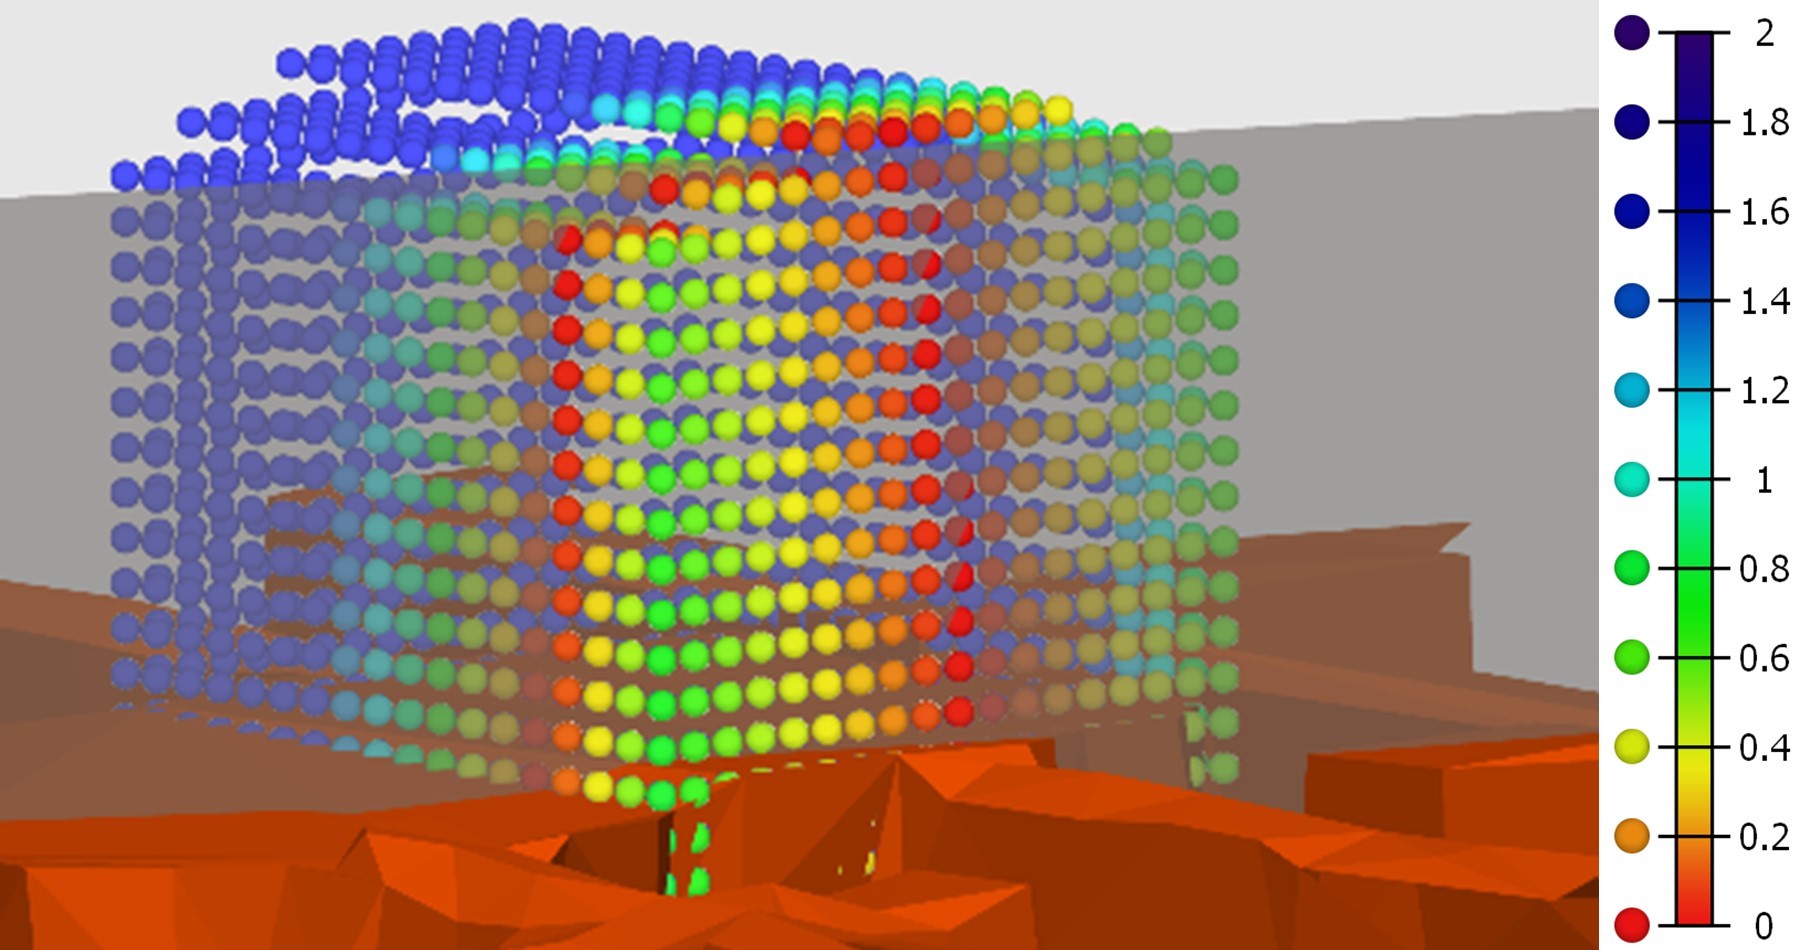
Blasthole verticality
Concept
The angle calculated in regard to the horizontal axis for the closest blasthole. -1 = Vertical down holes. 0= Horizontal holes. 1 = Vertical up holes.
Interpretation
Blast-induced damage.
Characterise how up holes vs down holes impact OB and UB.
Example
Distribution of blastholes verticality along the design surface. Green means down hole and purple mean up hole.
Dip of the design surface
Concept
The dip calculated from the normal vector associated with the octree block (coloured by degree).
Interpretation
Influence of gravity.
Characterises how OB and UB are affected by the effect of gravity.
Example
Distribution of the dip for each octree along the design surface (dots in the image). Warm colours (90°) mean the design face attached to the octree is vertical.
Direction of the design surface
Concept
The direction calculated from the normal vector associated with the octree block (coloured by degree).
Interpretation
Influence of orientation with respect to stress and rock mass properties.
Characterise how OB and UB are affected by face orientation.
Example
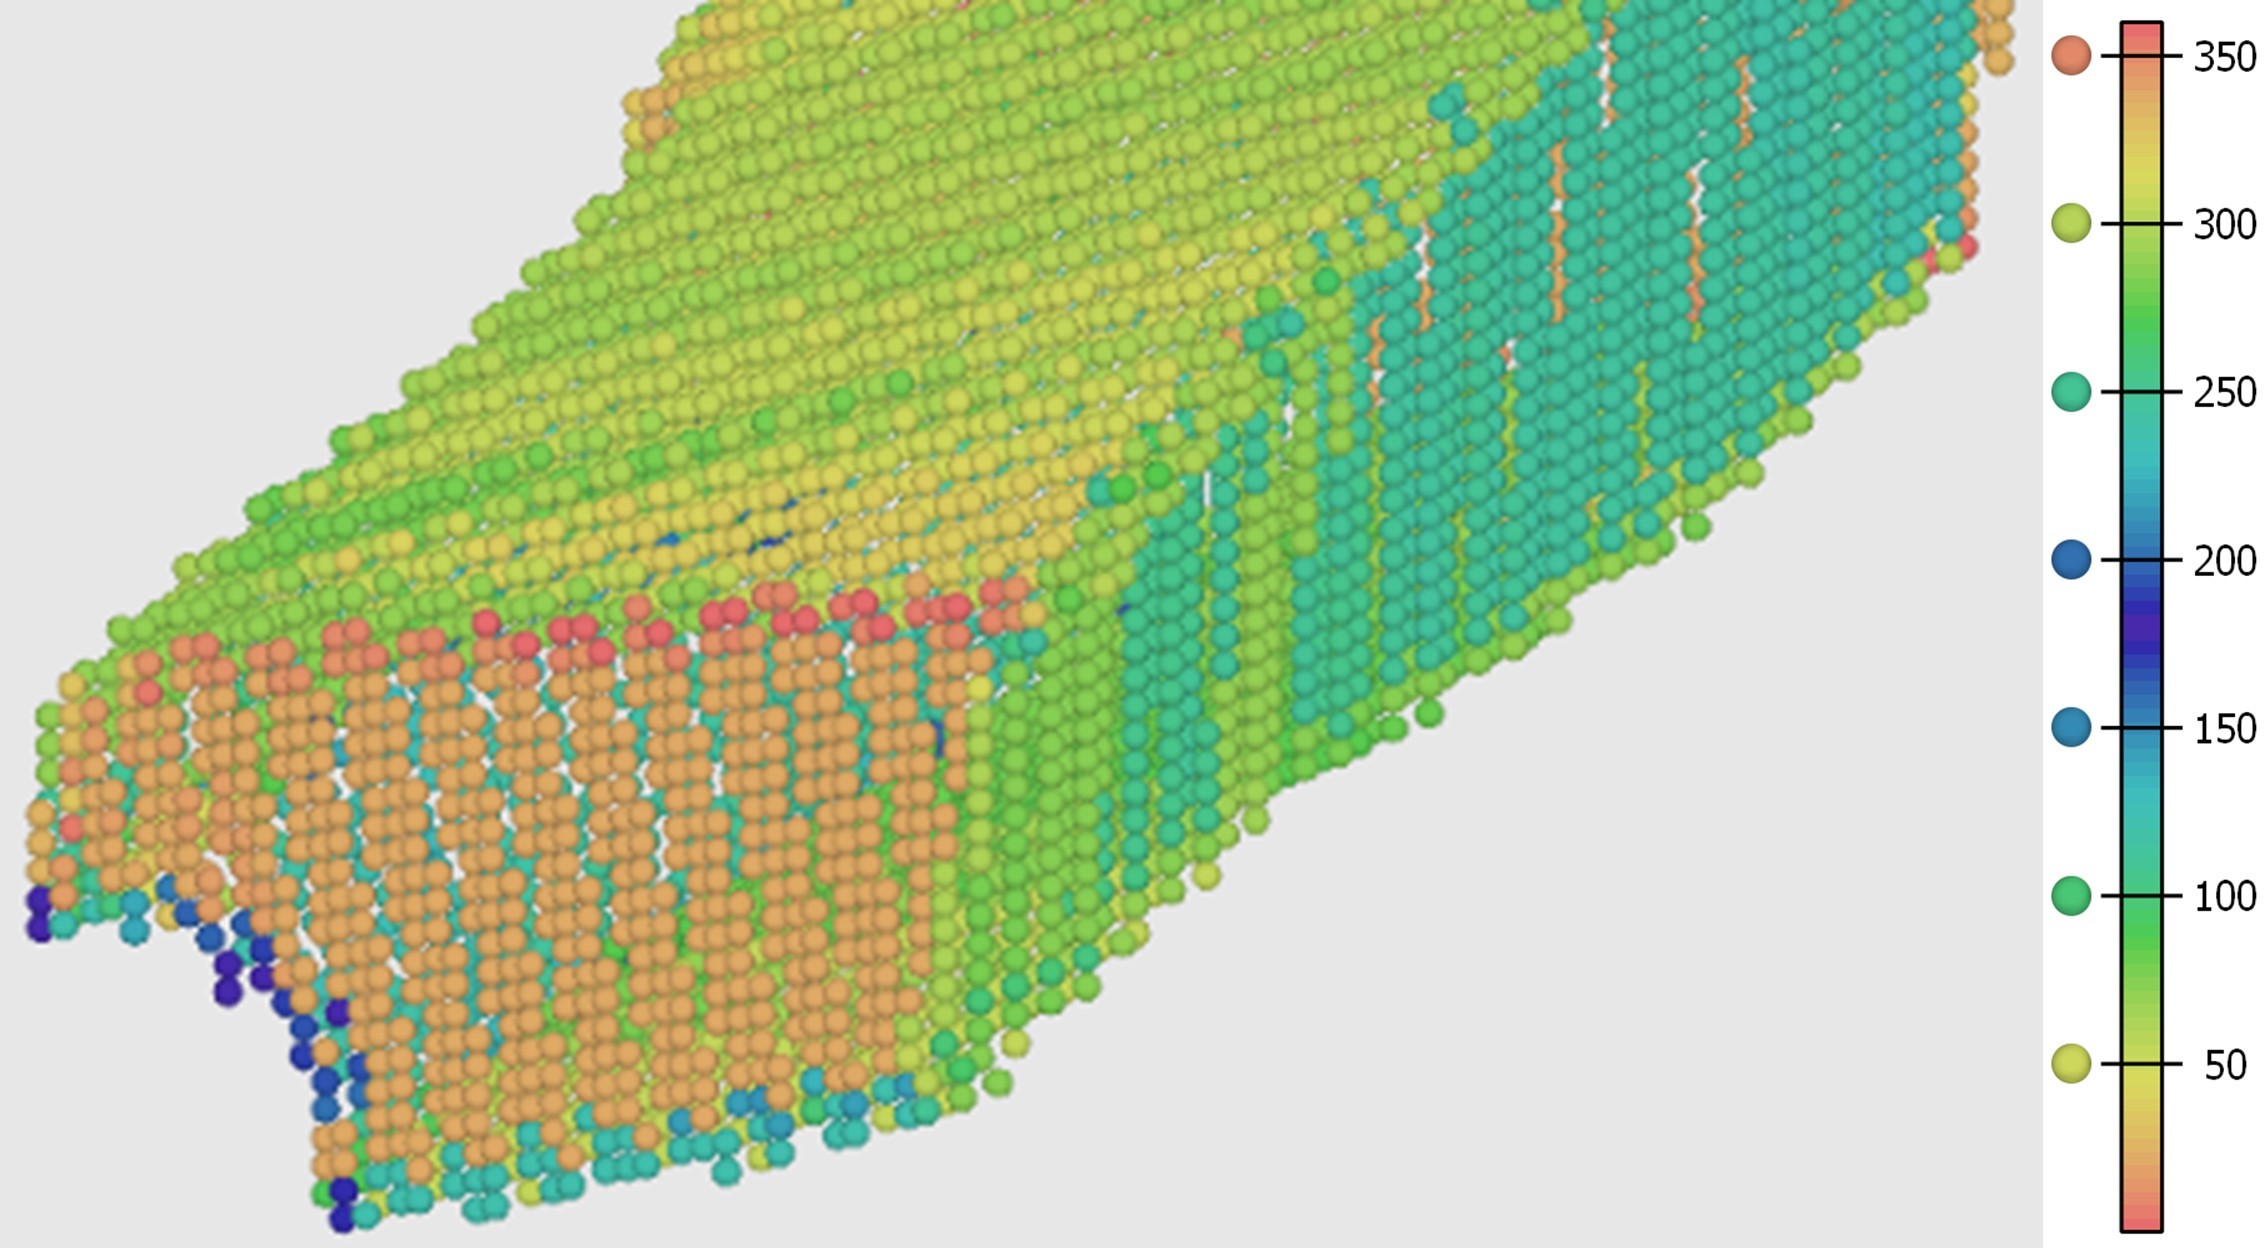
Distribution of the direction for each octree along the design surface (dots in the image). The direction varies from 0 to 360°.
Effective radius factor (ERF)
Concept
Calculated by measuring, at regular radial angle intervals, the Distance from a point located on the selected surface of the stope to the edge of that surface. A maximum value is obtained towards the center of the surface.
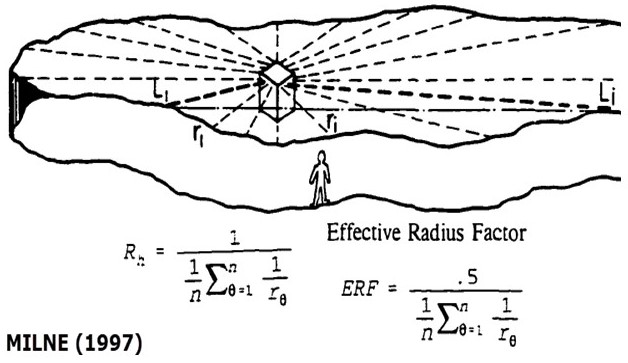
Interpretation
Local stability conditions - deformation of excavated span.
Characterise how OB and UB are affected by the size and geometry of the faces.
Example
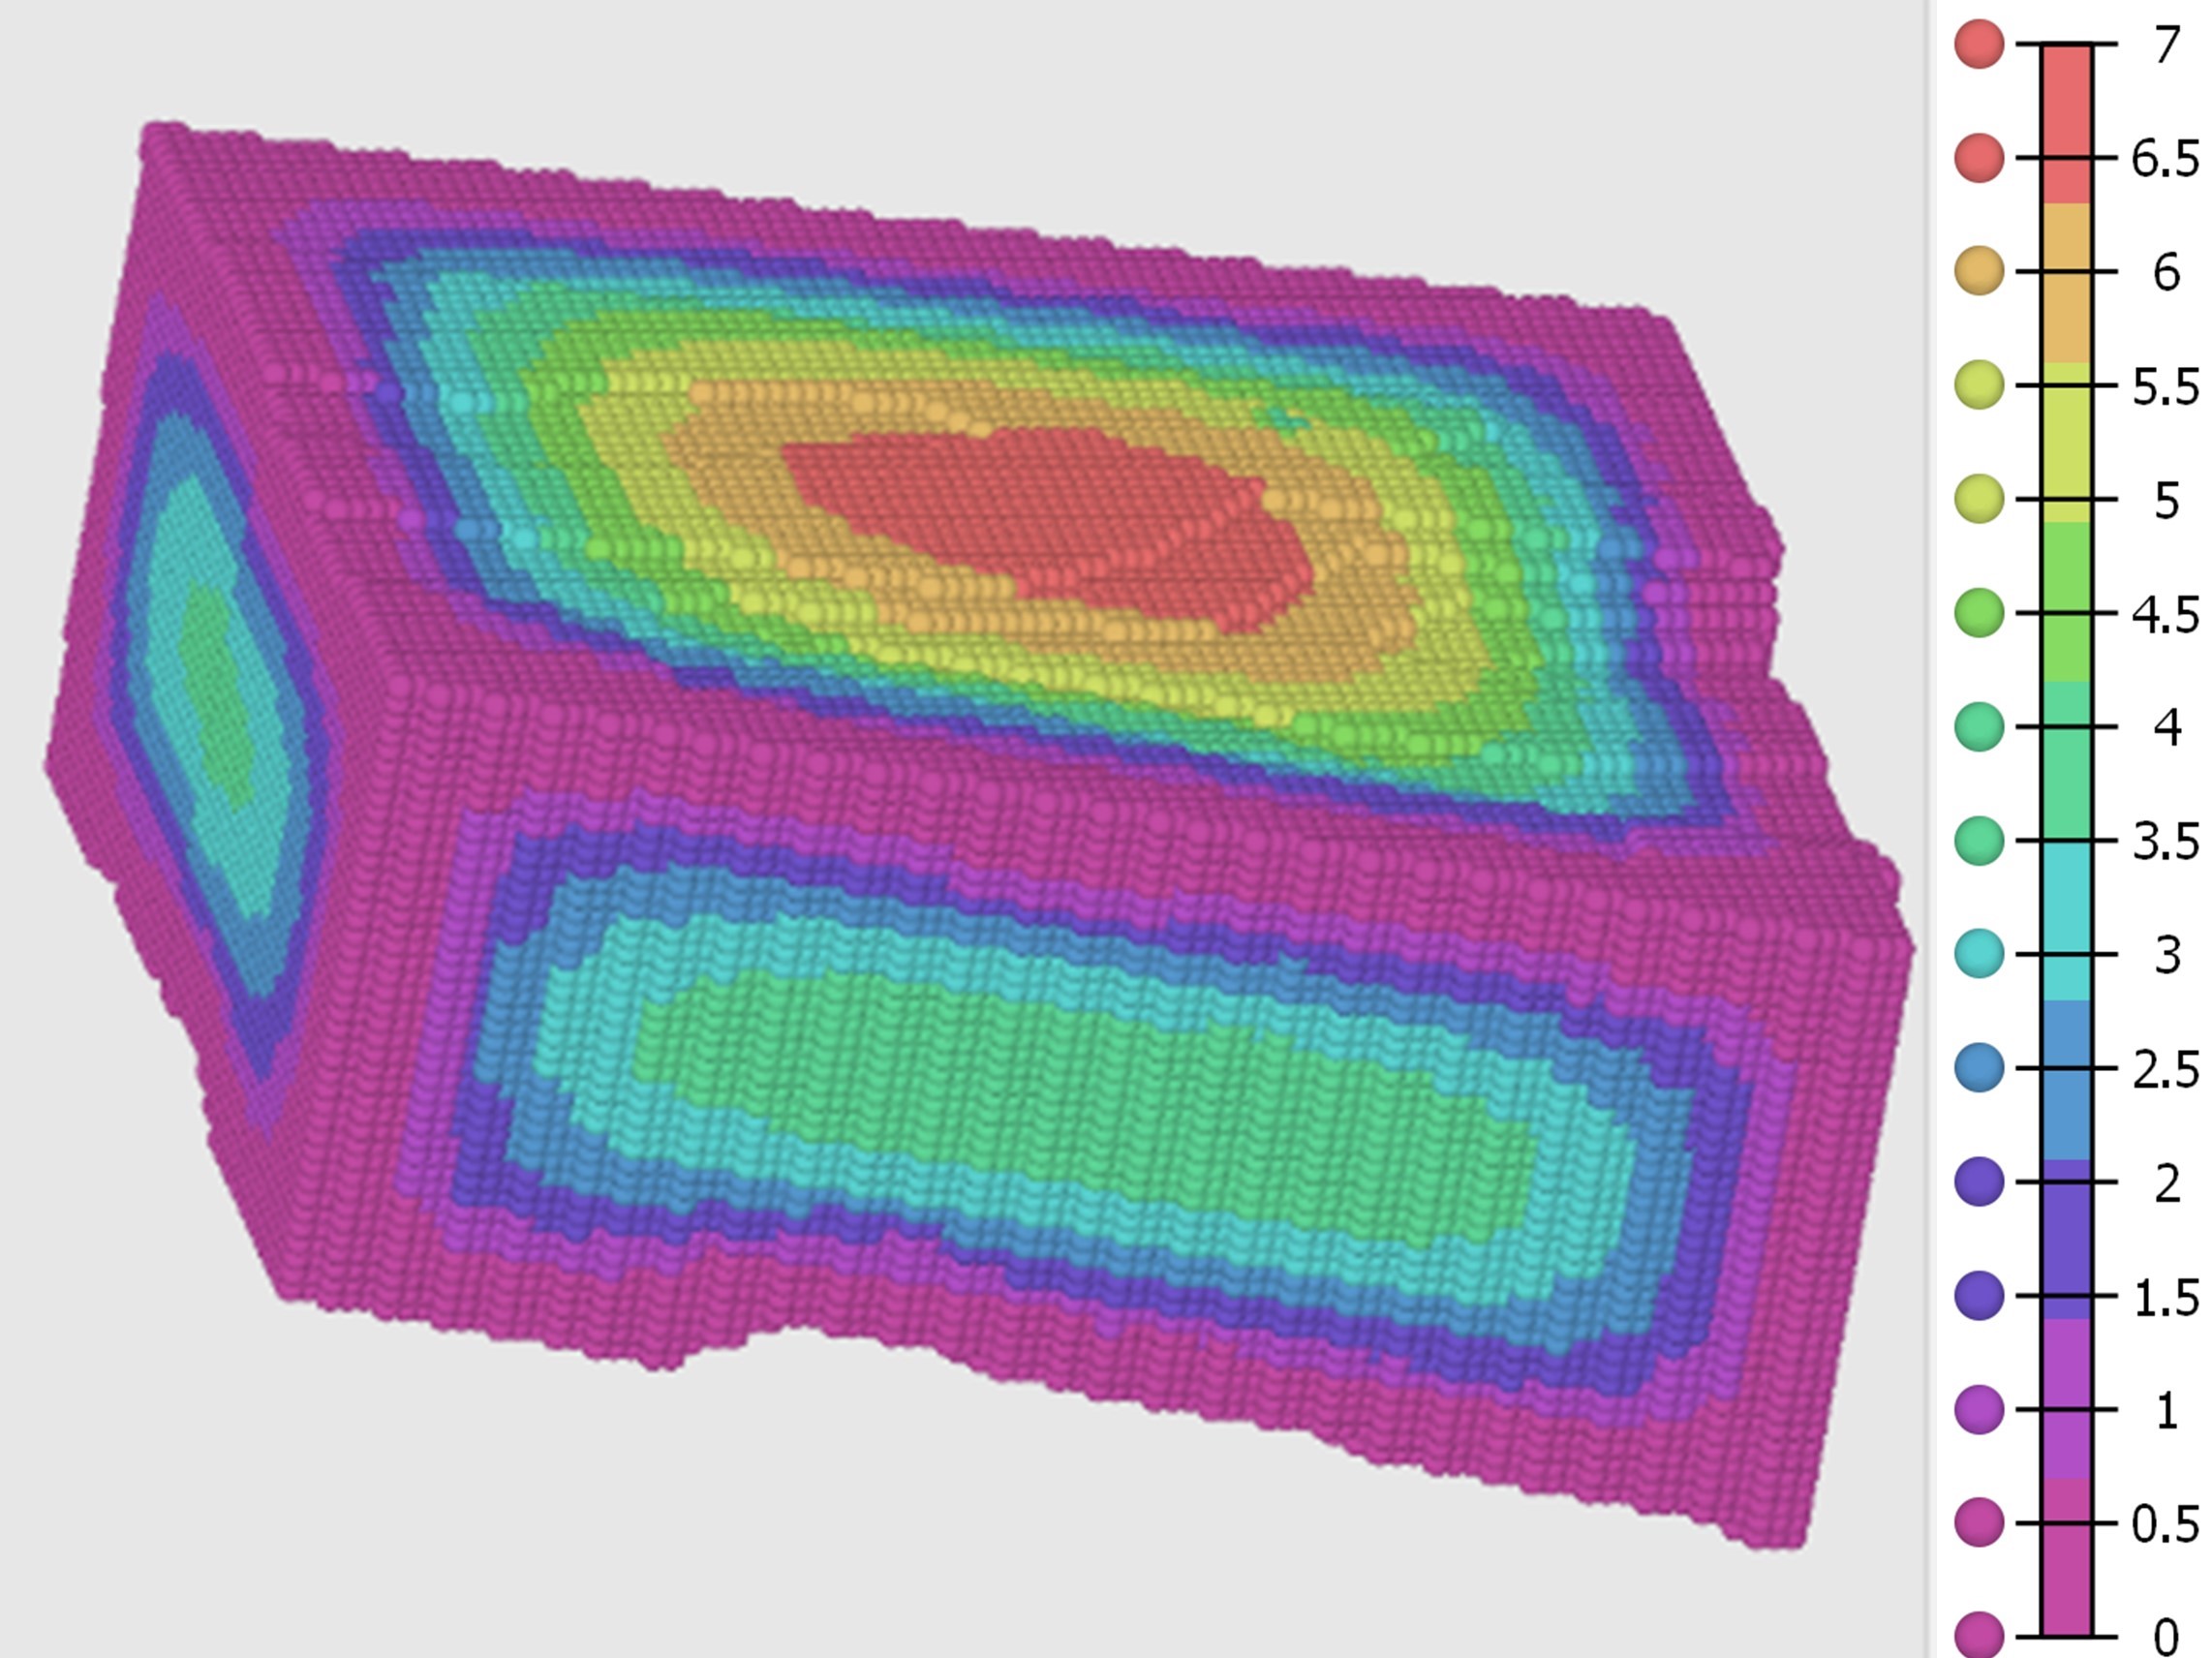
Distribution of the ERF for each octree along the design surface (dots in the image). Warm colours mean the octrees are further away from the surface edges and have higher stability concerns.
Distance to Development CH
Concept
The stope design as well as the drifts are 'wrapped' in a convex hull. Distance (coloured by meter) is found from an octree block to the nearest point on the convex hull surface.
Interpretation
Local stress conditions.
Loss of confinement.
Characterise how OB and UB are affected by the complexity of the geometry and the cutting of the stope by the drives.
In comparison with the stope geometry complexity parameter, the undercut considers the full geometry of the void and the impact the drives have.
Example
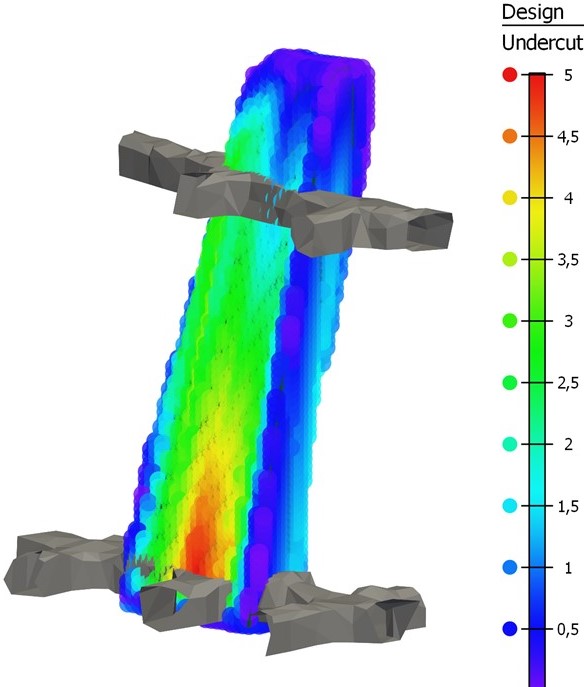
Distribution of the undercut for each octree along the design surface (dots in the image). Warm colours indicate that, due to the presence of the drives and/or the shape of the stope, the octrees are further away from the simplified shape that wraps the stope and drives, and highlights areas where there can be a loss of confinement due to how the drives cut the stope.
Distance to drives
Concept
Distance to the nearest drift in regard to the octree's position.
Interpretation
Deconfinement and gravity effect on design surface areas near the structures.
Damage induce during development.
Characterise how OB and UB are affected by the presence of drives.
Example
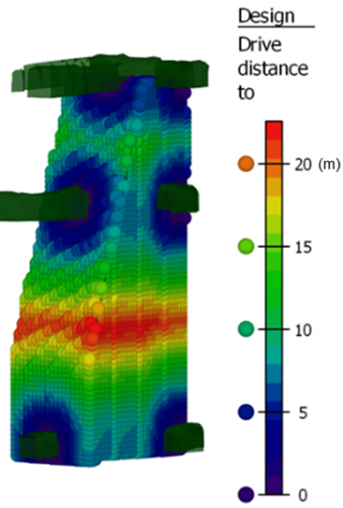
Distribution of the Distance to the drives for each octree along the design surface (dots in the image). Cold colours (0m) means the octrees are on the drive or close and warm colours indicates the octrees are further away from the drives.
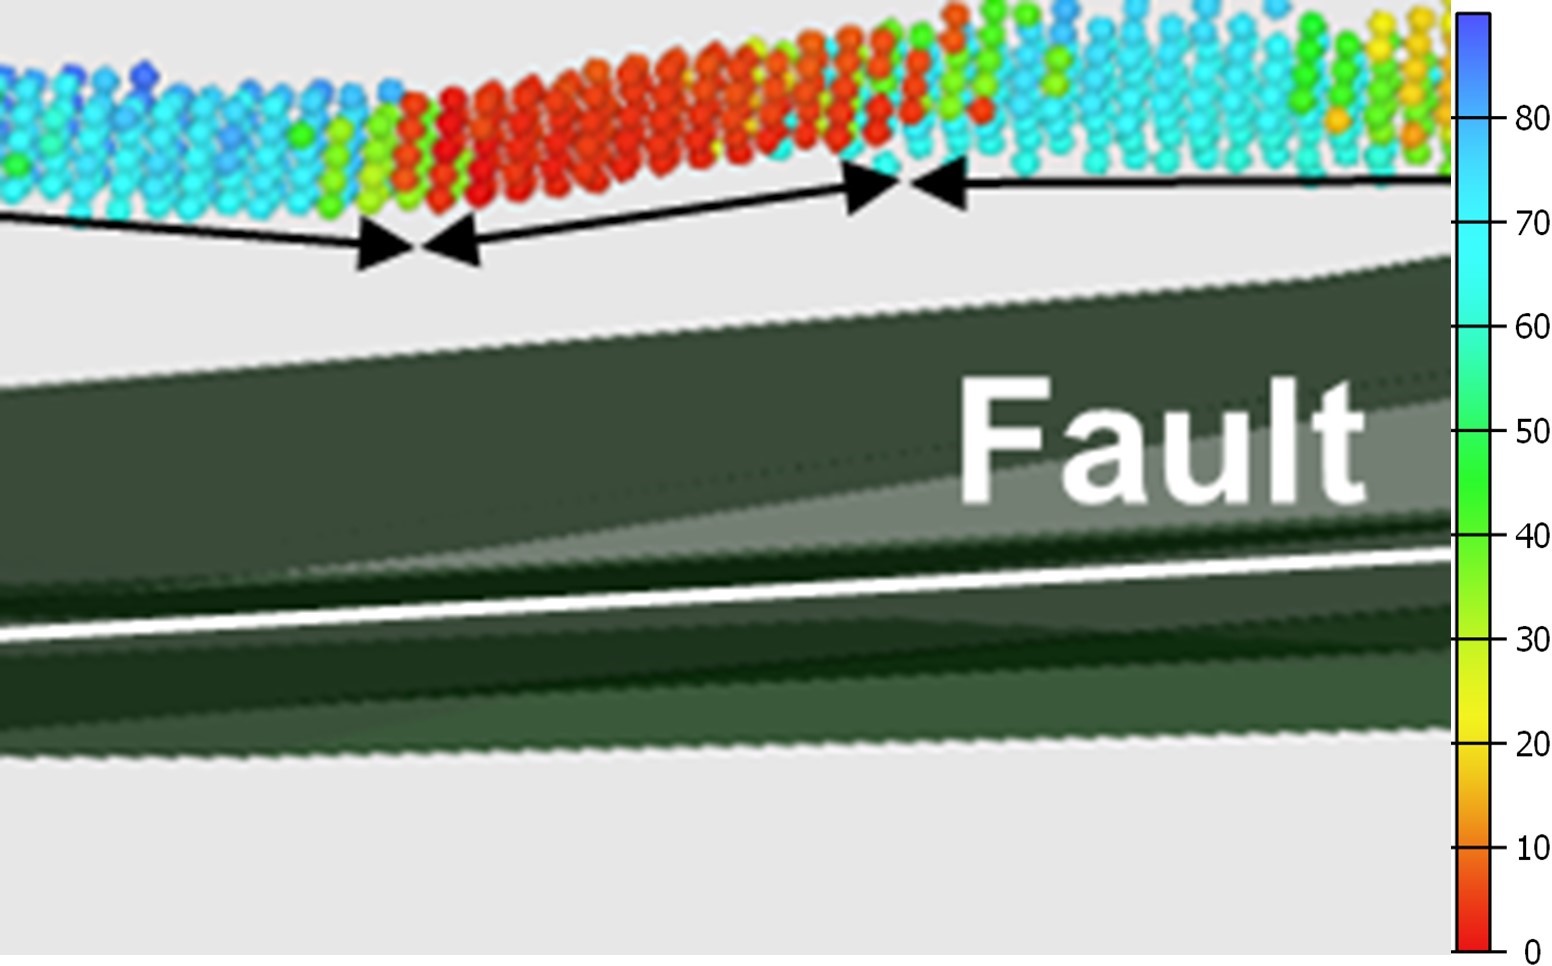
Distance to major structure
Concept
Distance (coloured by metre) from the octree block to nearest interpreted fault surface (distance parameter) and from the octree block to the sampling of the surrounding structures (mean distance parameter).
Interpretation
Kinematics - beam and wedge formation.
Characterise how OB and UB is affected by the presence of faults near the stope.
Example
Distribution of the distance to the nearest fault for each octree along the design surface (dots in the image). Cold colours mean the octrees are further away from the fault and less likely to be affected by the faults.
Angle to major structure
Concept
The average of the inverse distance3 weighted angle (coloured by degree) between an octree's design normal vector and the sampling of the structures. Convention: 90⁰ = Toeing, 0⁰= Parallel.
The difference in dip (in regards to the Z axis) and dip direction (in regards to the XY plane) is also calculated.
Interpretation
Kinematics - beam and wedge formation.
Characterise how OB and UB is affected by the angle of the fault to the design surface.
Example
Distribution of the angle to the nearest fault for each octree along the design surface (dots in the image). Warm colours (0°) means the octrees are parallel to their fault.
Geometrical parameters
Concept
Value from the nearest block of the geotechnical block model mapped to the octree.
Interpretation
Characterisation of how OB and UB are affected by the rock mass.
Example
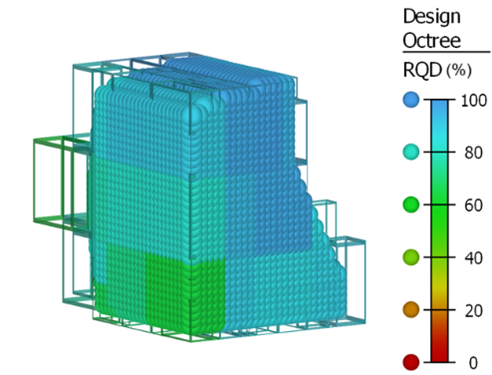
Distribution of the RQD for each octree along the design surface (dots in the image). Warm colours will highlight areas where there is poor rock mass quality.