FAQ
Wizard App
The wizard app enables you to quantify and define various information that will be pertinent for your analysis later on. Bad inputs will result in bad outputs. You want to make sure you are using the right data and defining your parameters correctly. Here are some common questions that can help guide you through the process.
I have lost access to the plugins?
Have you upgraded to the latest mXrap version recently? Verify that it is the mXrap + plugins version. If that is not your issue, please contact support.
I have design and mined geometries with and without the development cut out, which one should I use?
Either survey can be used. Tools in the reconciliation step allow you to exclude development volumes if needed, therefore not affecting the OB and UB volume calculated. However, the inclusion or exclusion of development in the design will have an impact on parameters such as the hydraulic radius or the ERF as the span will be impacted, especially for longitudinal stopes. If there is OB at the bottom of the drive, it could be missed at an octree level or miss allocated on a per face level.
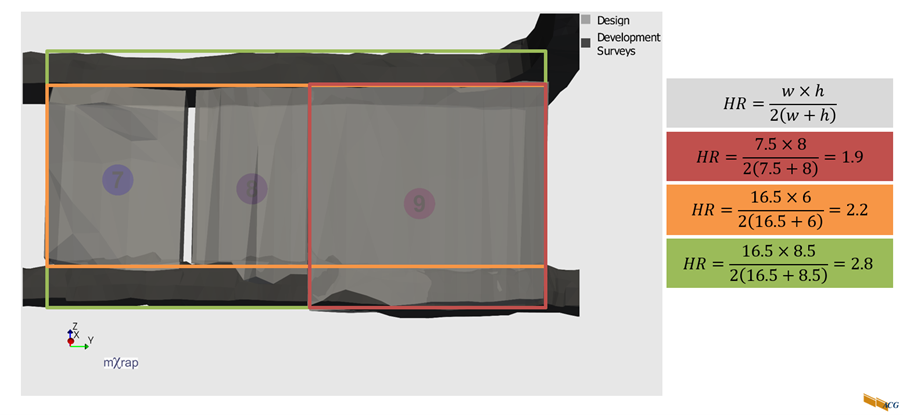
We recommend using the surveys with the development included as it gives a more accurate representation of the void you are mining. The key is however consistency and always using the same kind of survey, whichever one you decide to use.
Is it important to fix/decimate my surveys?
It is good to fix your surveys if an error (non-manifold or internal faces, for example) is shown as it can lead to incorrect volumes, issues with the projected distance calculations, or with the face detection. Tools are now available to remesh the design or CMS to help deal with these potential issues.
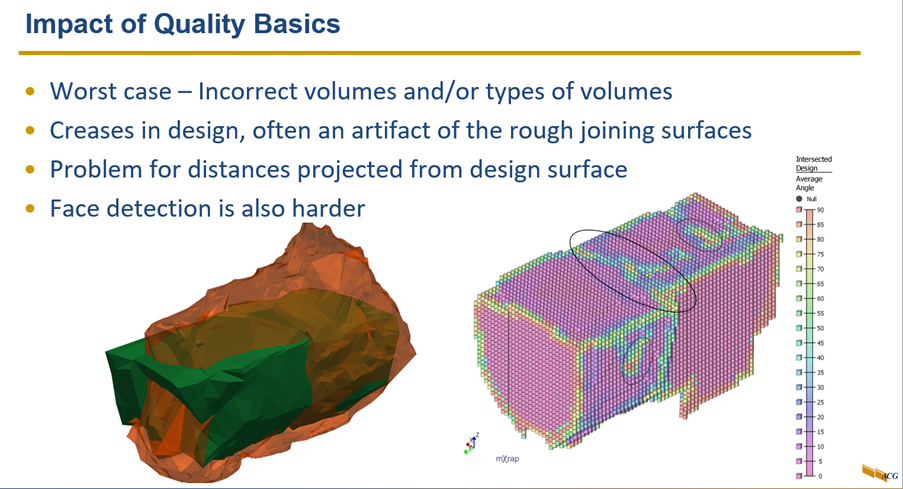
It is also good to decimate your surveys (if over 5,000 vertices) to speed up the process. New surveys coming from drone scans can contain over 100,000 vertices, and failing to decimate them will lead to unnecessarily long wait times during the design process.
What is an octree?
Octree represents the new advancement in stope reconciliation and analysis by considering a yet finer resolution. The 3D space is recursively subdivided into octree blocks until a desired resolution is reached along the design surface. These octrees represent point data on which parameters and stope performance is calculated, allowing to capture the spatial variation along the design surface.
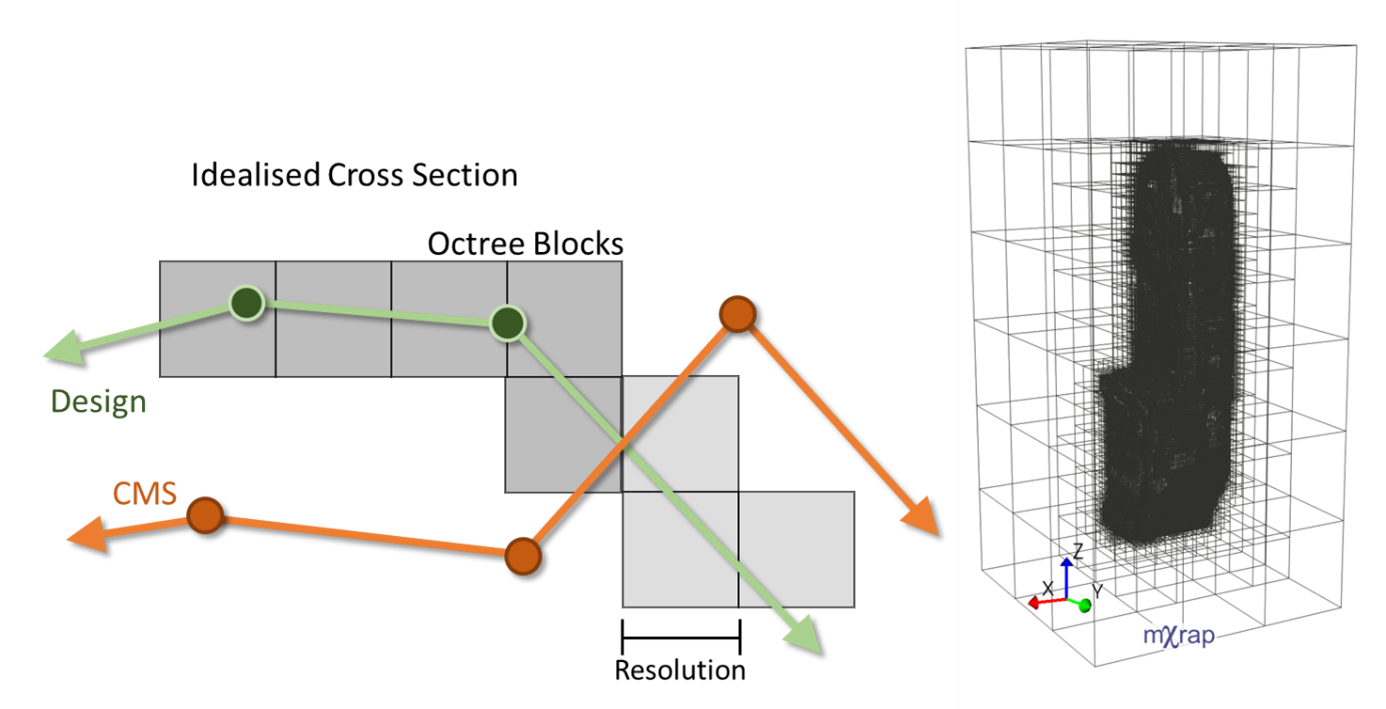
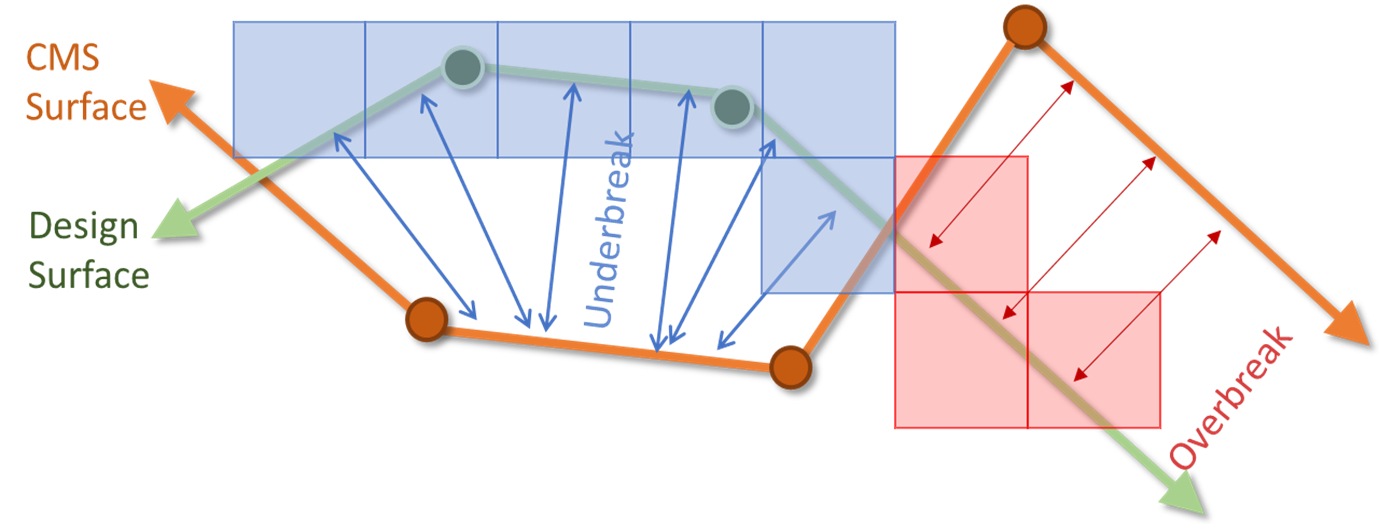
Stope performance is quantified by calculating the distance in the direction normal to the design surface and a surface generated by a cavity monitoring system (CMS).
Does the octree resolution matter?
The octree resolution will impact computation time, volume calculations and the face detection. Follow the recommendations in the octree step for optimal use.
How many faces should I be defining?
Standard stope shapes have six faces: hanging wall, footwall, floor, crown, and two side walls. This can differ if you have more complex geometries such as one with a stepped face. What should be considered when doing so is how it will be used later on. The faces will be used to quantify stope performance and various parameters per face. They will serve also as filters. Therefore, consider the geometry and root causes of OB and UB when defining the faces. The key is consistency in how you decide to define your face.
Should I be using all my structures from my structural model?
The goal of the Fault parameters is to investigate the impact of structures on stope OB; therefore, you should consider only structures known to cause OB issues. If you have no idea which structures are impacting OB, you can always use all the structures, conduct root cause analysis in the analysis app to identify the critical structures and then reprocess the structural parameters in the Utilities app as a second pass to further investigate these key structures.
What is the goal of the convex hull?
The convex hull parameter is used for analysing the impact of undercut and overcut of the drives on the stope performance, serving as proxy to assess the potential relaxation around the stope due to the drives and how that impacts OB. Therefore, when clipping your drives you are looking to include sections of the drives around the stope that can cause these issues. Again, the key here is consistency in how you decide to clip the drives and the amount of drive exceeding the stope you decide to keep. As a rule of thumb, if the drive is parallel to the face, you want it in, if it is perpendicular and the face is vertical, you want it out, but if the face is at an angle, you will want part of that drive.
Is it important to have the blast dates mapped to the stope?
The blast date will serve as a timeline for your mining sequence and can be used to assess your OB and UB over time. If you have the prediction app, they also serve when building the model.
Why are my data/surveys not showing in the right location?
Verify if the X and Y location have been flipped. When working with .dtm files, the X and Y are usually inversed, therefore when importing them, you will need to switch the two.
Why are my geotechnical data not updating after modifying the inputs?
Try using the reset or recalculate options in the panel. If you updated the csv files, make sure the columns and the order are the same.
Why am I not seeing the stope I just processed in the list?
If this happens, try refreshing the stope list using the button in the panel.
Prediction App
The prediction app is a powerful tool that helps assess the mined geometry that could be expected for a future stope, and the leading causes of OB and UB as well as the economic impact. Here are some common questions that can help guide you through the process.
Does it matter which model I use?
The models are built from a set of stopes for which stope performance is controlled by similar parameters. It is possible that your mine site has multiple models based on the area of the mine or the type of stope (longitudinal vs transversal for example) as the controlling factors can change. Therefore, it is important to use the appropriate model to obtain the most accurate prediction. In the options, you will also find models with blast data and ones without blast data. The models without blast data can be used on a longer period, when the drill design for the stope hasn't been made, while the model with blast data can be used on short term when the drill design is available. The accuracy of the model will be affected, depending on the impact of the drill design.
Should I be filtering out the development and paste walls for the predictions?
Development faces should be filtered out for predictions as they represent usually void and therefore do not make sense to predict. A predicted distance of 0m will be given to octrees excluded from the predictions. As for paste walls, it would depend on the recency of the model as paste isn't considered in older models, but it is to a certain extent in the newer ones. Contact support for information on your model.
Which prediction surface threshold should I be using?
This is up to the user, but these thresholds can be used to get the best estimate of the OB and UB volumes. Some testing is necessary to determine which percentile you should use. These thresholds serve to generate the predicted surfaces upper and lower limits and do not impact octree analysis in the prediction results window.
Why is running the prediction slow?
Running the predictions with the SHAP feature can take 10-15 minutes with the default settings (depends on the model). If your computer is taking longer than this, you can consider modifying the SHAP variables. Ncore represent the number of cores used to run parallel SHAP simulations. Increasing it will accelerate the process, but you should verify first how many cores your computer has first. Nsim represent the number of simulations for estimating the SHAP values. Increasing it will increase the computational time. Decreasing it will reduce the computation time, but will also make the SHAP estimate less stable, so be careful if you decide to play with these variables.

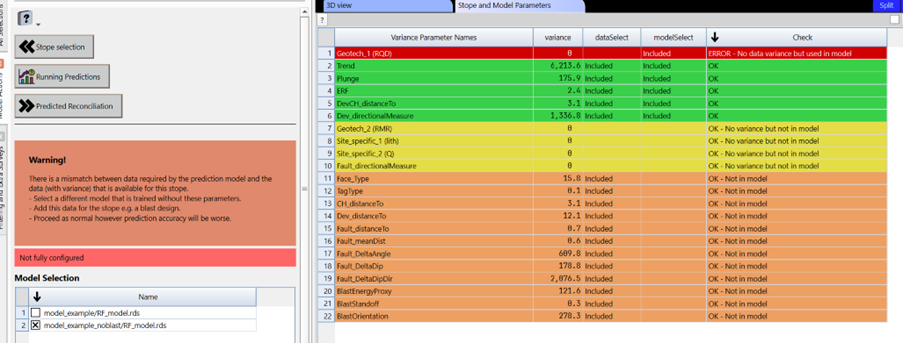
Why am I getting a warning message for the model I selected?
The model is based off a selection of parameters. If issues in the dataset are detected for these parameters, a warning message will show up. You can investigate which parameter is causing you trouble. Often it will be related to missing data.
Can I use the predicted geometry in other softwares?
Yes, you can export the predicted surfaces in the predicted reconciliation step and use it in other softwares. The surveys will be in #Standard Data/Stope Reconciliation/Databases/Stopes/name of the stope you are predicting/PredictionResults.
What is SHAP and how can I use it?
It stands for SHapley Additive exPlanations and are a way to explain the output of any machine learning model. Each parameter is assigned an importance value representing its contribution to the model's predicted distance for each octree. SHAP values show how each parameter affects each final prediction, the significance of each parameter compared to others, and the model's reliance on the interaction between parameters.
SHAP is insightful as the values are in the same unit as the prediction output, which in this case is meters (i.e. a value of 1 would mean an increase of 1m to the predicted distance). SHAP can be used to understand the impact of each parameter on the predictions, helping to identify which parameter is most likely the cause of the OB or UB at a specific location (waterfall chart), or in general for a face or the stope (importance chart). Marker styles in the 3Dview are helpful to see which parameter was more important for each octree. Of course, this analysis is based off the prediction model and the parameter used. Any other key information not considered by the model shouldn't be ignored.
How do I use the grade window?
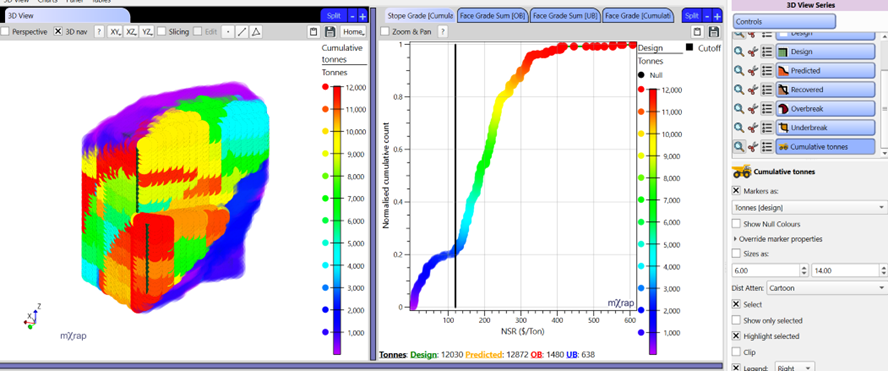
The objective of this app is to provide the information required for investigating stope performance optimisation. Therefore, OB, UB, dilution and loss of ore all need to be considered to make a sound decision. The grade window provides the base information about dilution, loss of ore and value at three level of resolution (per stope, face and octree) to help with the decision making. The dilution and loss of ore will depend on the cutoff value you set.
If you are interested in knowing the value in the stope, the per stope or per face table summaries as well as the grade panel dilution summary will be the go-to tools. These can be useful for your stope meetings.
If you are interested in knowing where your dilution or loss of ore will come from, we suggest looking at the 3D view. Using the different series for the different volumes you can see the distribution of your ore value in your stope. You can determine where potential dilution would come from using the predicted or OB series, or loss of ore using the UB serie.
If you are interested in the grade distribution in the stope for mucking or the mill, the cumulative chart with the 3d view (cumulative tonnes series) will be your go-to tools.
Analysis App
The analysis app is a powerful tool for understanding stope performance. Given the number of tools, it can be overwhelming if you are new to the app. Here are some hints on how to use the app depending on your objective. For all cases, the first and most important step will be filtering the data to keep only the stopes, faces or tags you want to analyse.
How can I see what kind of OB or UB I am getting?
The three main tools to quickly look at your OB or UB are the 3D view, cumulative chart and the tables.
- Tables (specially the LITE version) are helpful to quickly to look at stope performance numbers.
- The cumulative chart per stope (use the two series) or per face can be used to visualise the distribution of your OB or UB for the data you have selected.
- The 3D view holds different series to help with visualising stope performance.
- Design and mined survey series to compare the geometries
- The octree design series coloured by projected distance for better visualisation of the spatial distribution of OB and UB
- The octree recovered, OB and UB series to distinguish these different volumes. *The per stope and per face series can be coloured by stope performance.
How can I compare stope performance?
The two main tools to quickly do comparison are the 3D view and cumulative chart.
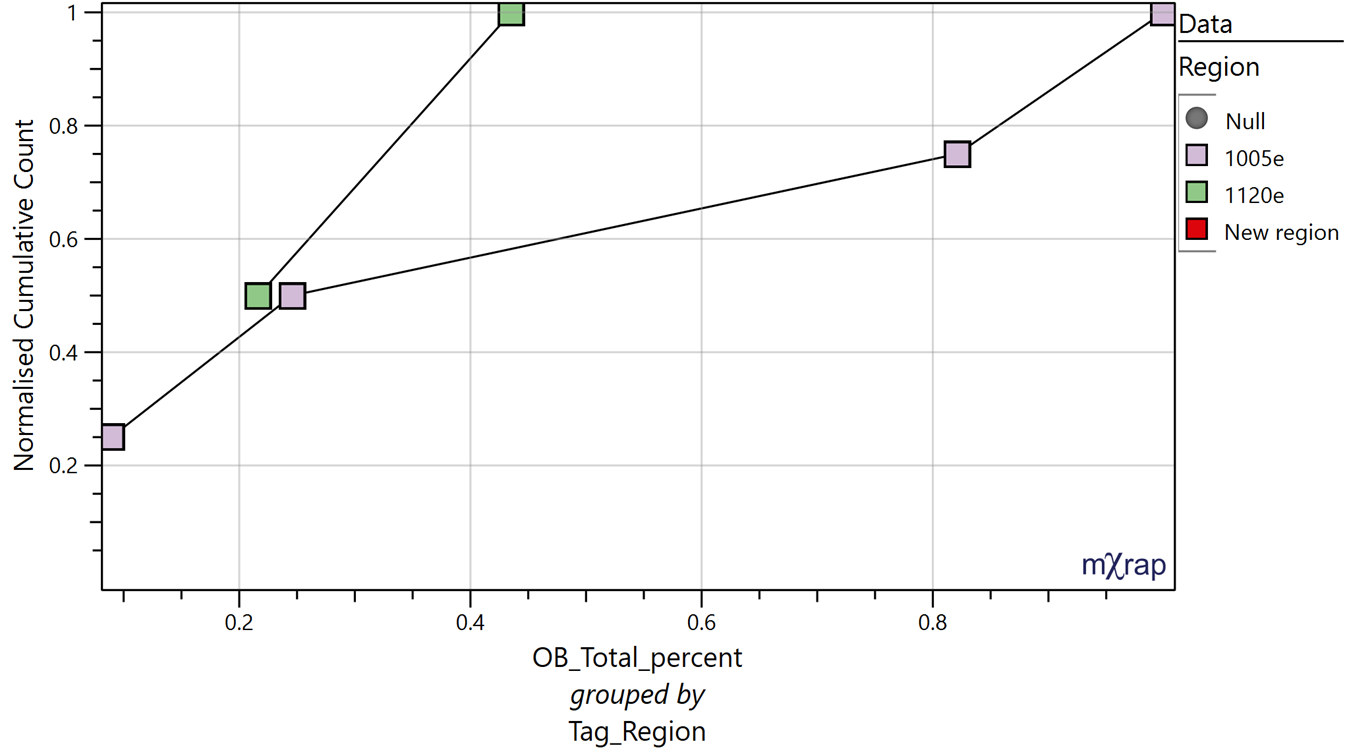
- The cumulative chart per stope and per face can be used to compare two parameters (use the two series chart per stope) or different groups with a parameter (use the group by). For example, comparing OB between two different regions.
- The 3D view will help with visualising the different groups you are comparing (use the marker styles to help with this).
Per stope and per face tags are very helpful to compare different regions, faces, ground support, etc. Be sure to set them up properly during the reconciliation in the wizard app.
How can I analyse potential root-causes of stope performance?
Most of the tools in the app will help with doing root cause analysis, but for analysing specific parameters, the VS charts or the 3D chart will be the go-to tools. The 3D view will help with visualising the data in the charts. Use the design octree series coloured by your parameter of choice overlayed by the survey series associated to the data you are analysing (i.e. show the structures if you are looking into them).
If you already know what parameter you want to analyse, then you can do your analysis specifically around that parameter. If you are new to this dataset and are looking to get a general understanding, then we suggest this investigation methodology:
- Start broad, looking at per stope performance to assess the general trend in the OB and UB by comparing different groups and determine what amount of OB and UB you are dealing with, how it tracks over time, etc.
- Refine your analysis to per face, identifying the critical faces for OB and UB, identifying trends between faces and broad parameters or averaged per face parameters.
- At this stage you should have a general grasp of your OB and UB. Refining the analysis per octree will help with understanding the distribution of your OB and UB within your stope and faces, such as the impact of you drill pattern, the presence and position of structures, undercutting your stope, etc.
Use the selection options to help with assessing the data across multiple tools.
How can I use to app for design purpose?
If you have identified your critical parameters already then you can use the charts to set thresholds based on your critical parameters to help guide your design. You can then visualise the design you have process to see areas of your stope that exceed these thresholds.
You can also plot the stability chart in the per face window for designing new areas or to see how your current stope compares to your other stopes.
You don't have to wait for the stope to be mined to process your design. You can visualise stopes in the analysis app even if you have processed the design only at this stage.
How do I determine if I need a new prediction model?
There is no set tool for specifically determining this, but what we want to look for, is whether the prediction error is overall increasing with each new prediction, indicating that the model isn't properly capturing the root causes of OB and UB in the new stopes. You can use the per stope and per face summaries to get a general idea, or the SPE chart in the advance section. You can also contact support and we will happily have a look for you.
Can I export the results?
You can export the summary table into csv format for use in other software.