FAQ
How do I create and assess a user defined trigger in Short Term Response Analysis?
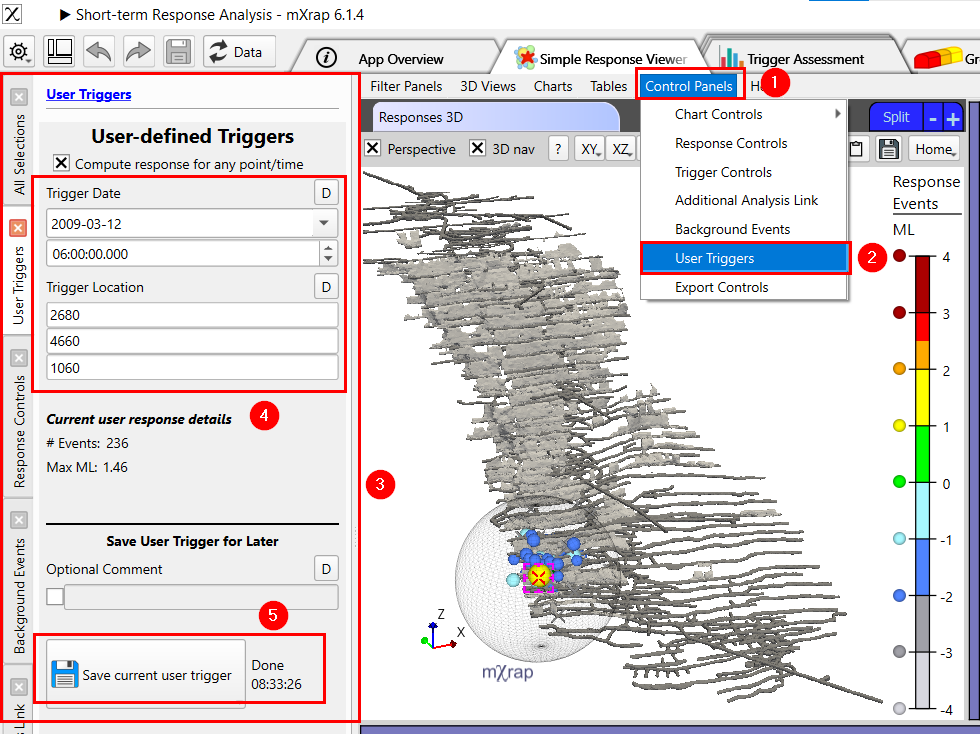
Open the Simple Response Viewer window in the app then to create a User Trigger:
-
Click "Control Panels"
-
Click "User Triggers"
-
The "User Triggers" panel will then open on the left
-
Input the location and date of your trigger
-
Save the trigger
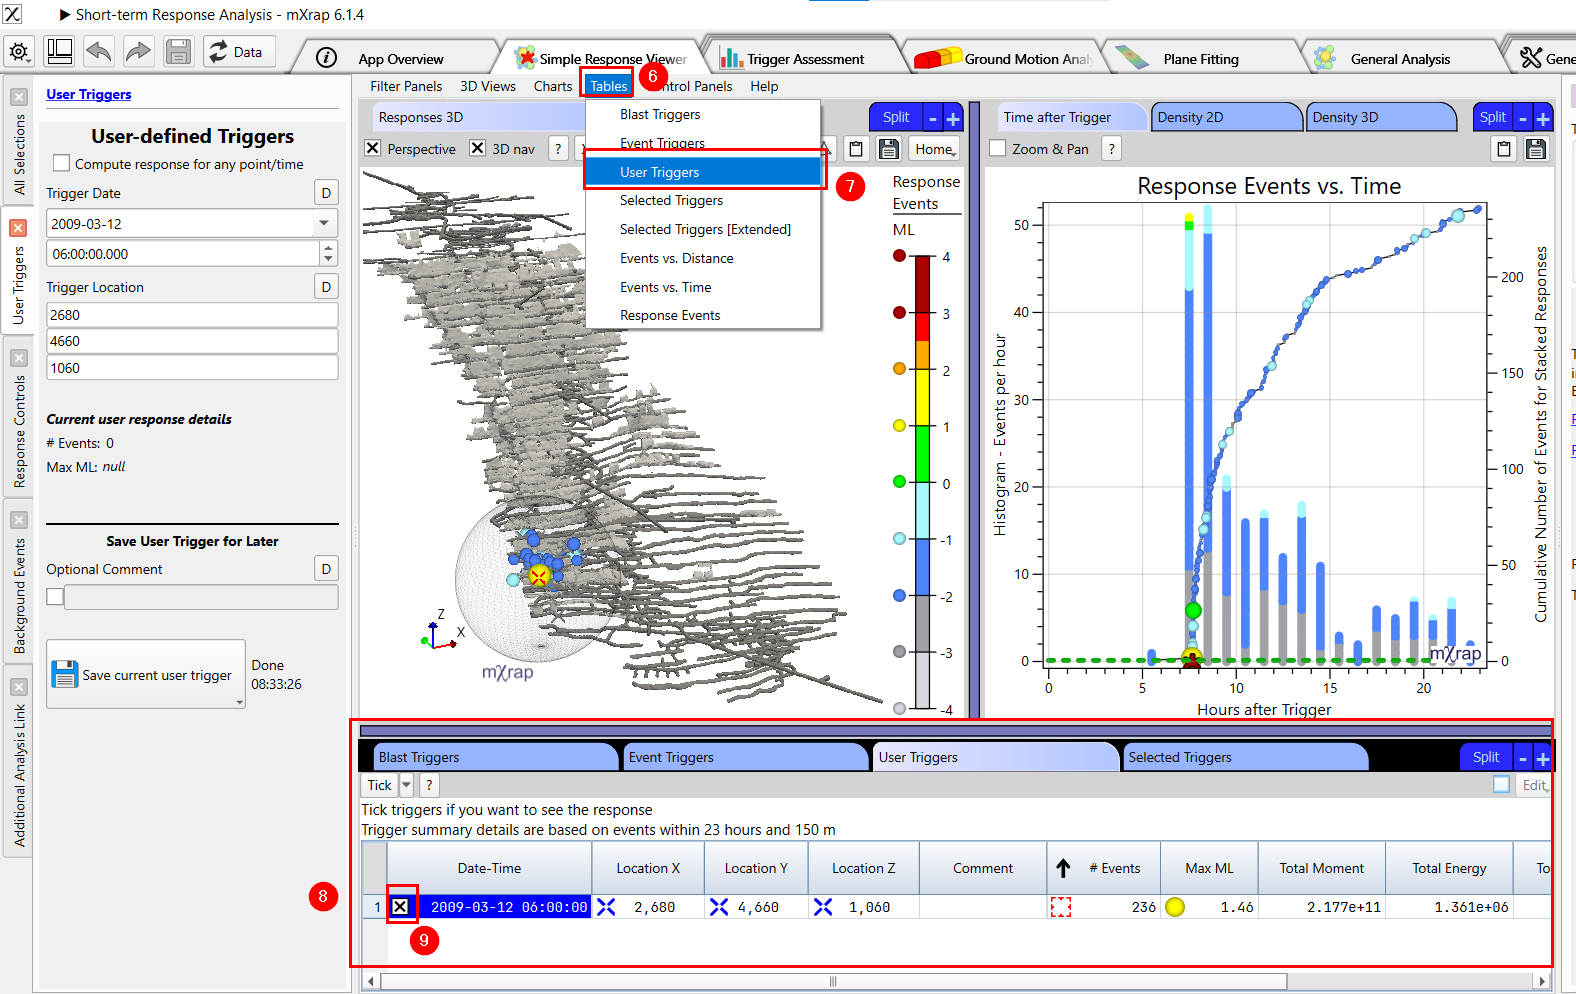
Using the trigger for analysis: 6. Click "Tables"
-
Click "User Triggers"
-
The User Trigger Table View will appear
-
Select your saved trigger
Why is there no cumulative energy line?
The shape of the cumulative energy graph inherently has no diagnostic value and is often misleading. The accumulation of a logarithmic parameter is dominated by the largest events and results in a curve with a somewhat arbitrary, random shape which doesn’t represent the underlying stochastic process. The total energy released has some value and is included in the blast triggers table.
Why isn't it called Omori Analysis anymore?
Omori Analysis has been a bit of a misnomer in the mining industry. The Omori Law (and Modified Omori Law, MOL) is a mathematical relationship to describe the activity rate of aftershocks over time. There isn't really such a thing as 'Omori Analysis' or an 'Omori Chart'. What most people call an 'Omori Chart' is simply a cumulative events chart. Why make it more complicated than that!
What are the 'nearby' events?
Nearby events are shown in the Response 3D view and the Magnitude-Time chart to indicate events that are close, but just outside, the response time and radius. Events are 'nearby' if they occur: Less than 0.25 × time before the trigger, less than 2.0 × time after the trigger, and less than 2.0 × radius from the trigger.