Rock Mass Data Analyser (RMDA)
The Rock Mass Data Analyser (RMDA) enables users to input geotechnical data into mXrap, creating a comprehensive geotechnical database for borehole and mapping data. The application provides 3D visualisation, charting, and stereonet analysis capabilities.
Supported Data Types
The application currently supports visualisation and assessment of:
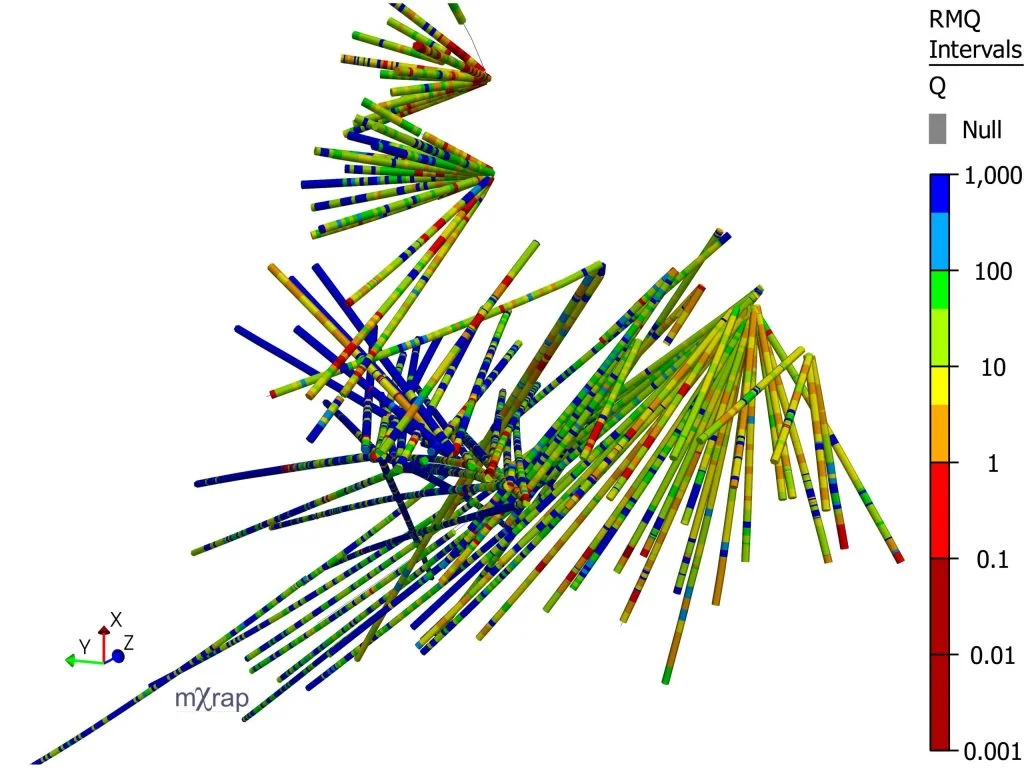
- Rock mass quality data: RQD, RMR, Q, Q', GSI
- Structural data: Joint orientations and conditions from scanline mapping and logging
- Laboratory test results: UCS, TCS, BTS
Key Features
Data Filtering and Visualisation
- Multiple filter options for borehole IDs, lithologies, data sources, joint sets, and rock strength test types
- Pre-set legends for all geotechnical data
- 3D location-based data selection and filtering
Statistical Analysis
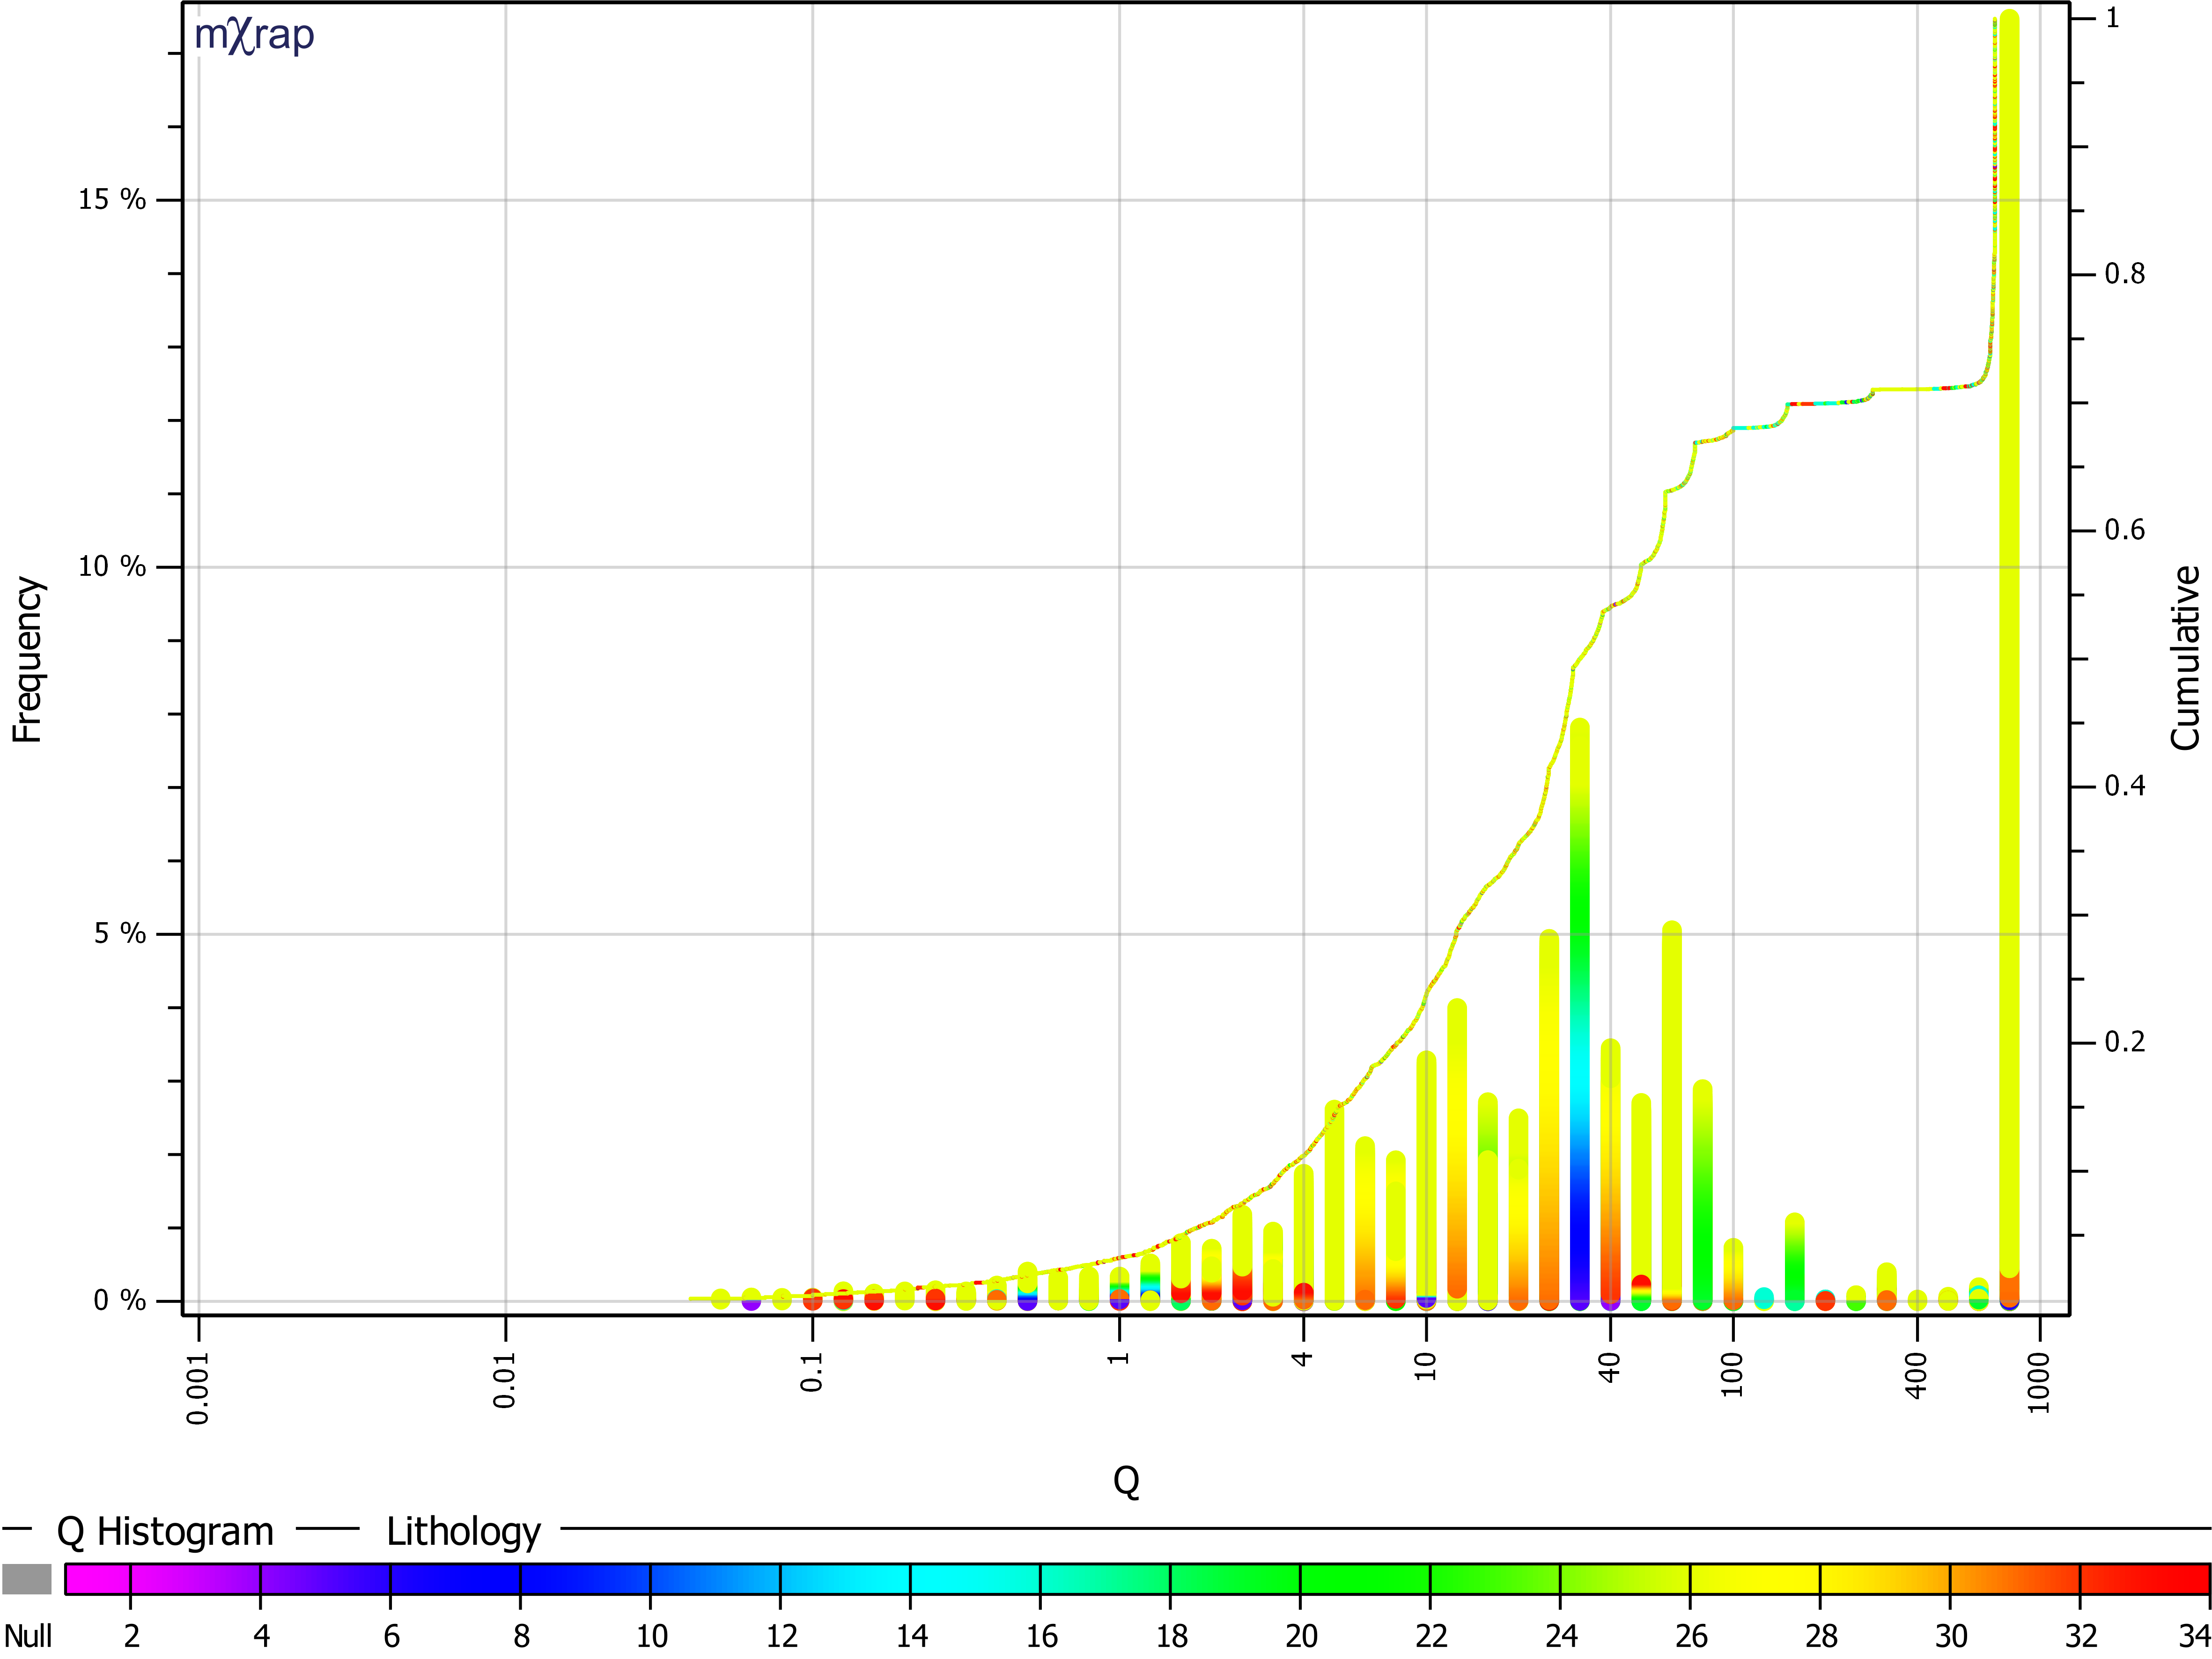
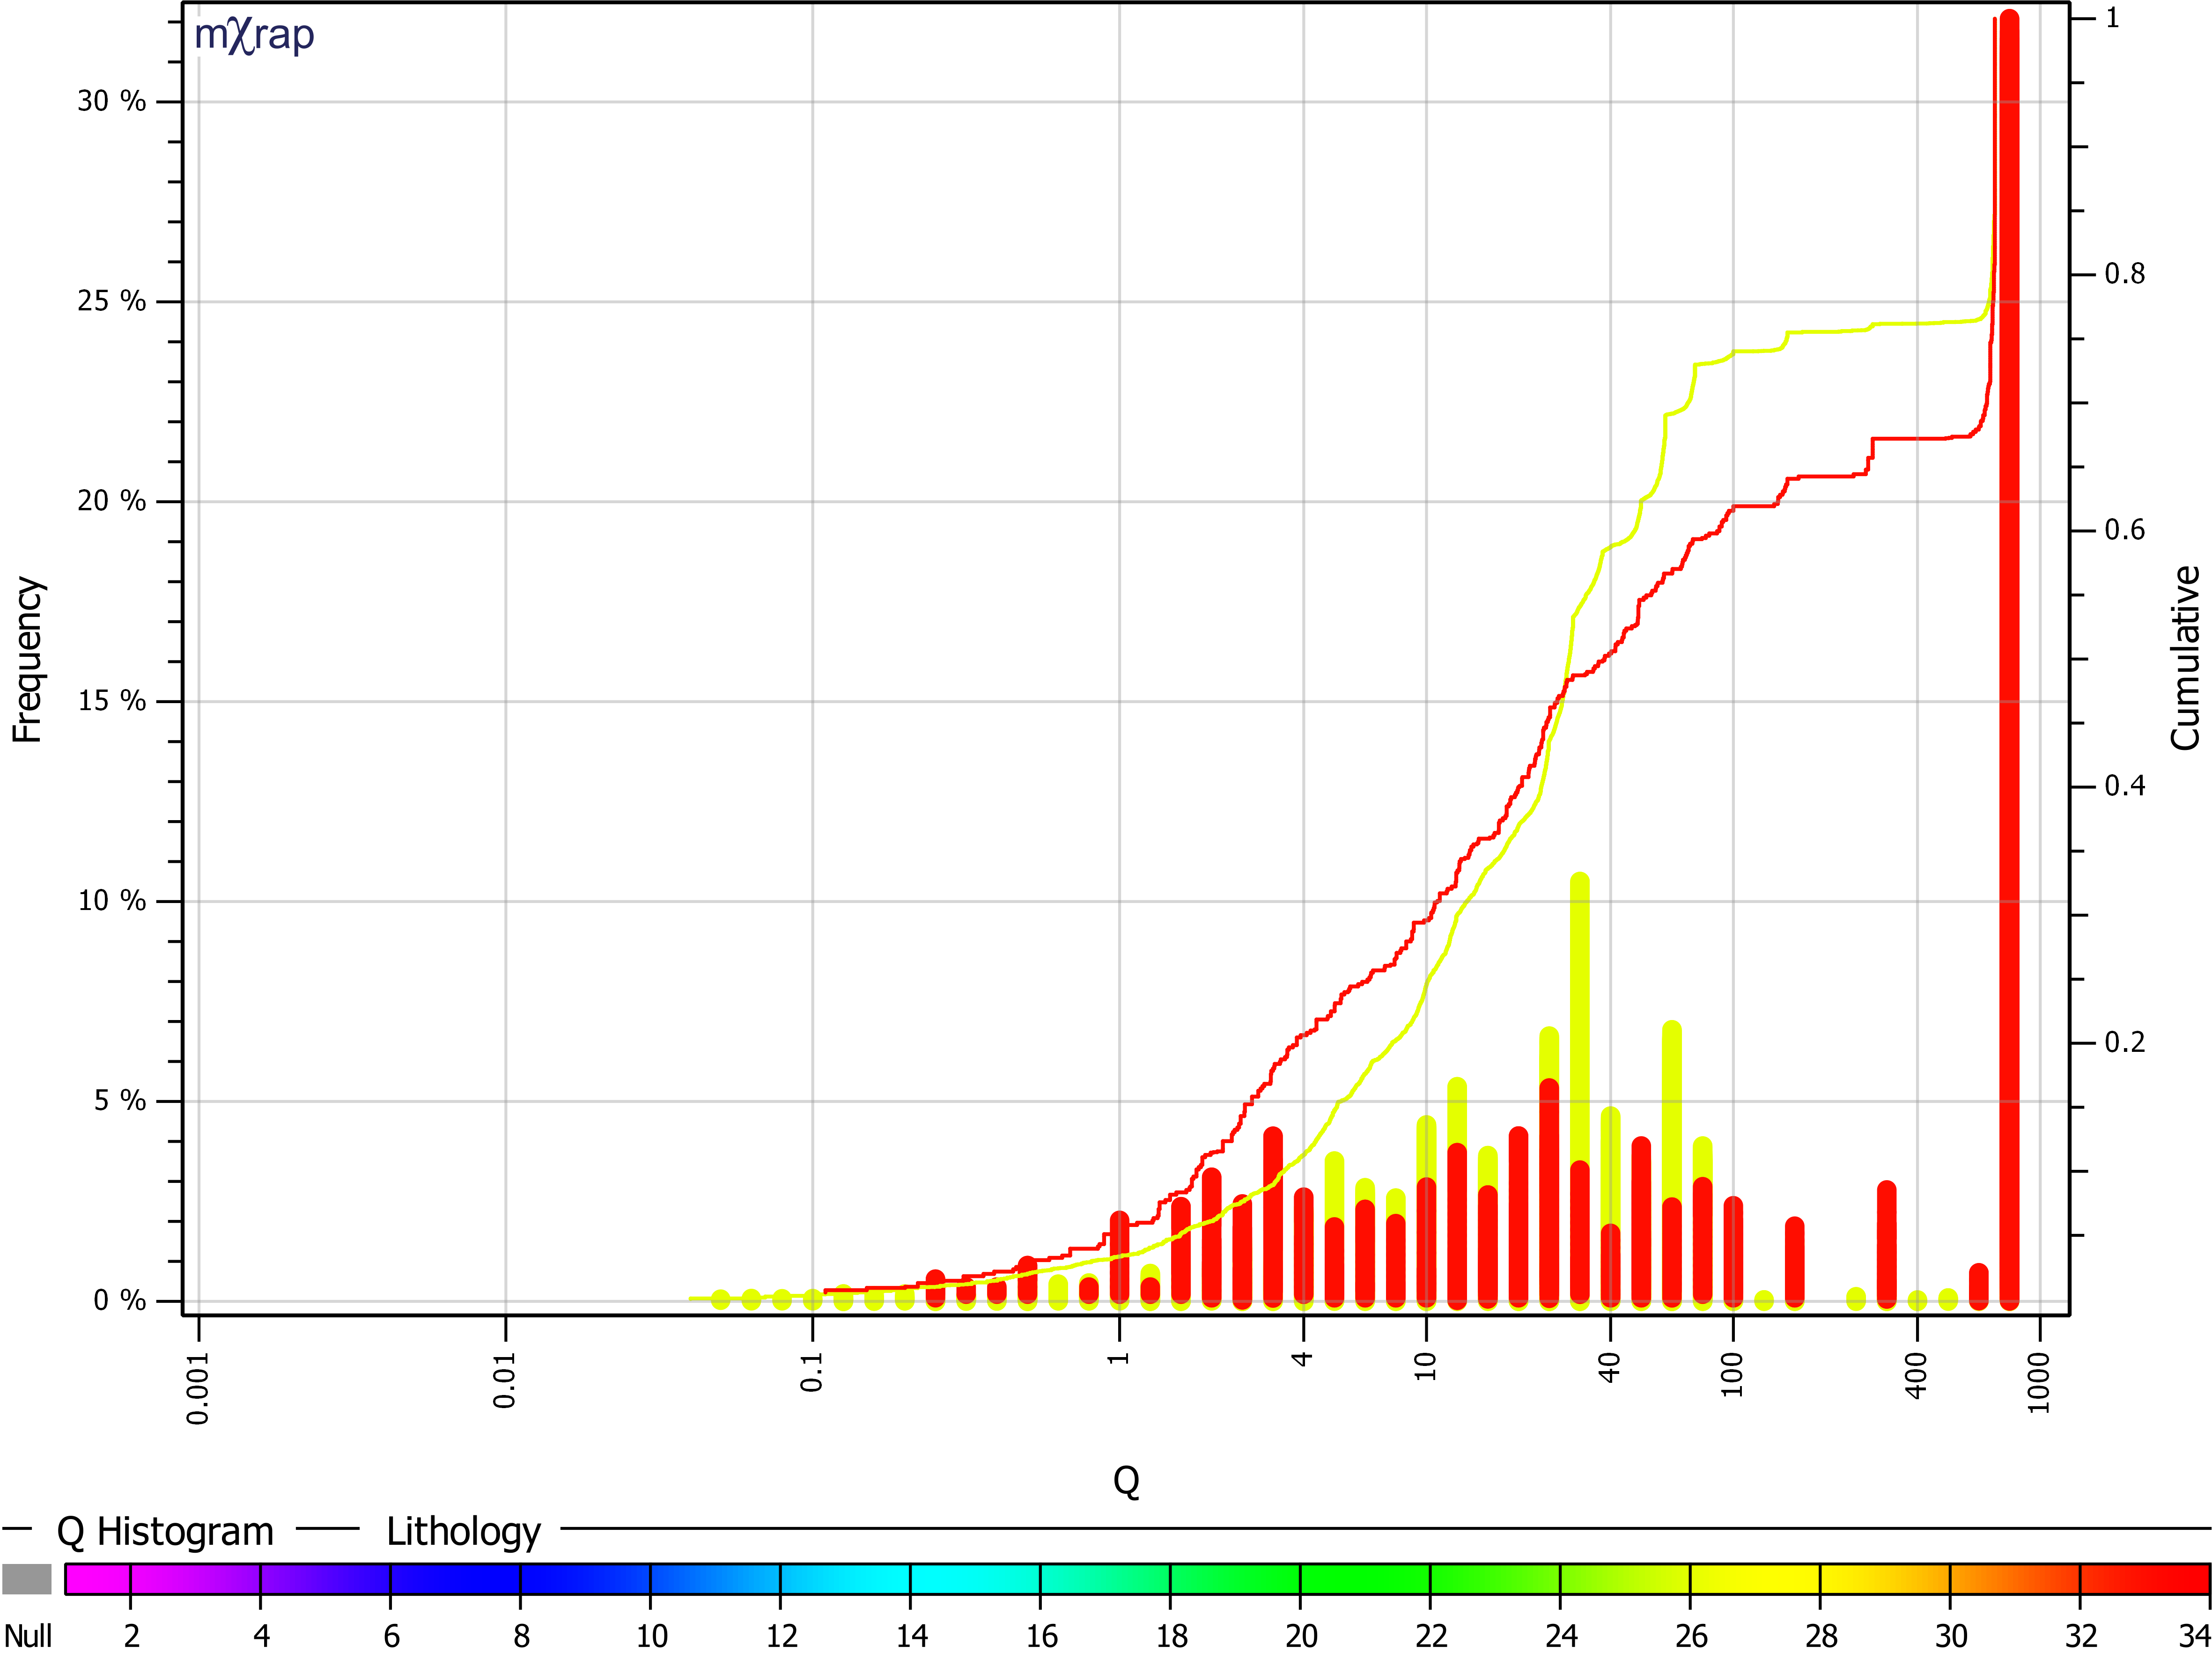
Generate histograms and CDF curves for rock mass quality data across various lithologies and boreholes. Lithologies can be combined or plotted separately, with 3D location selection enabling analysis of specific geotechnical domains.
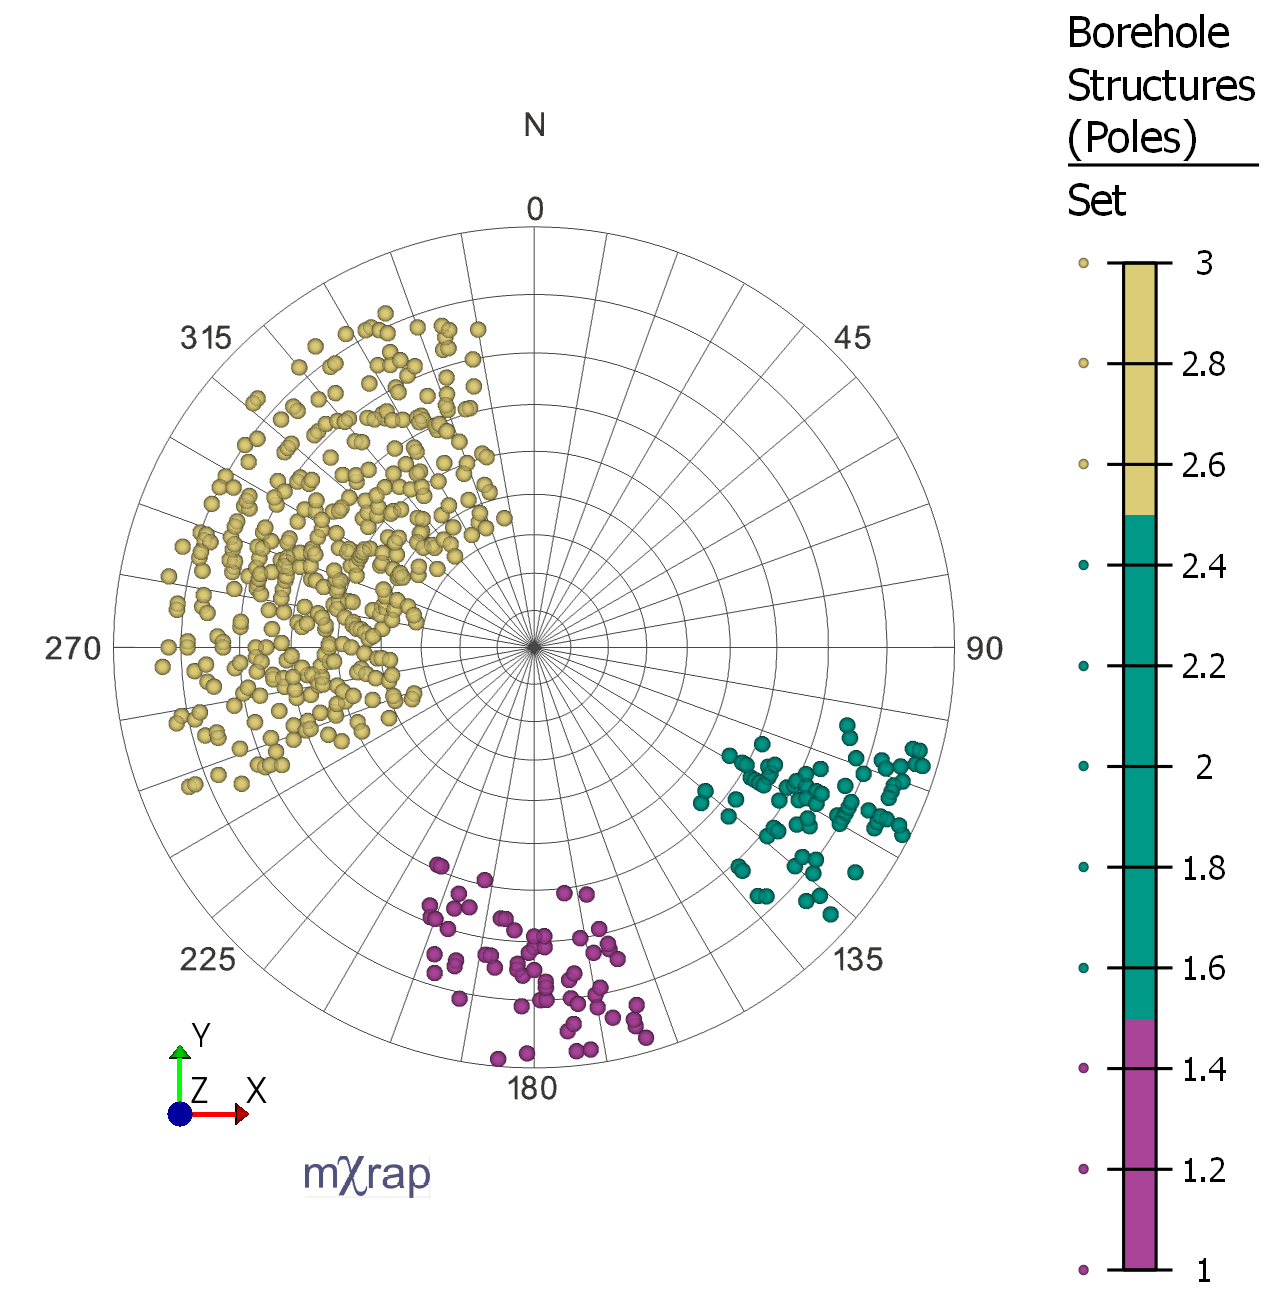
Structural Data Analysis
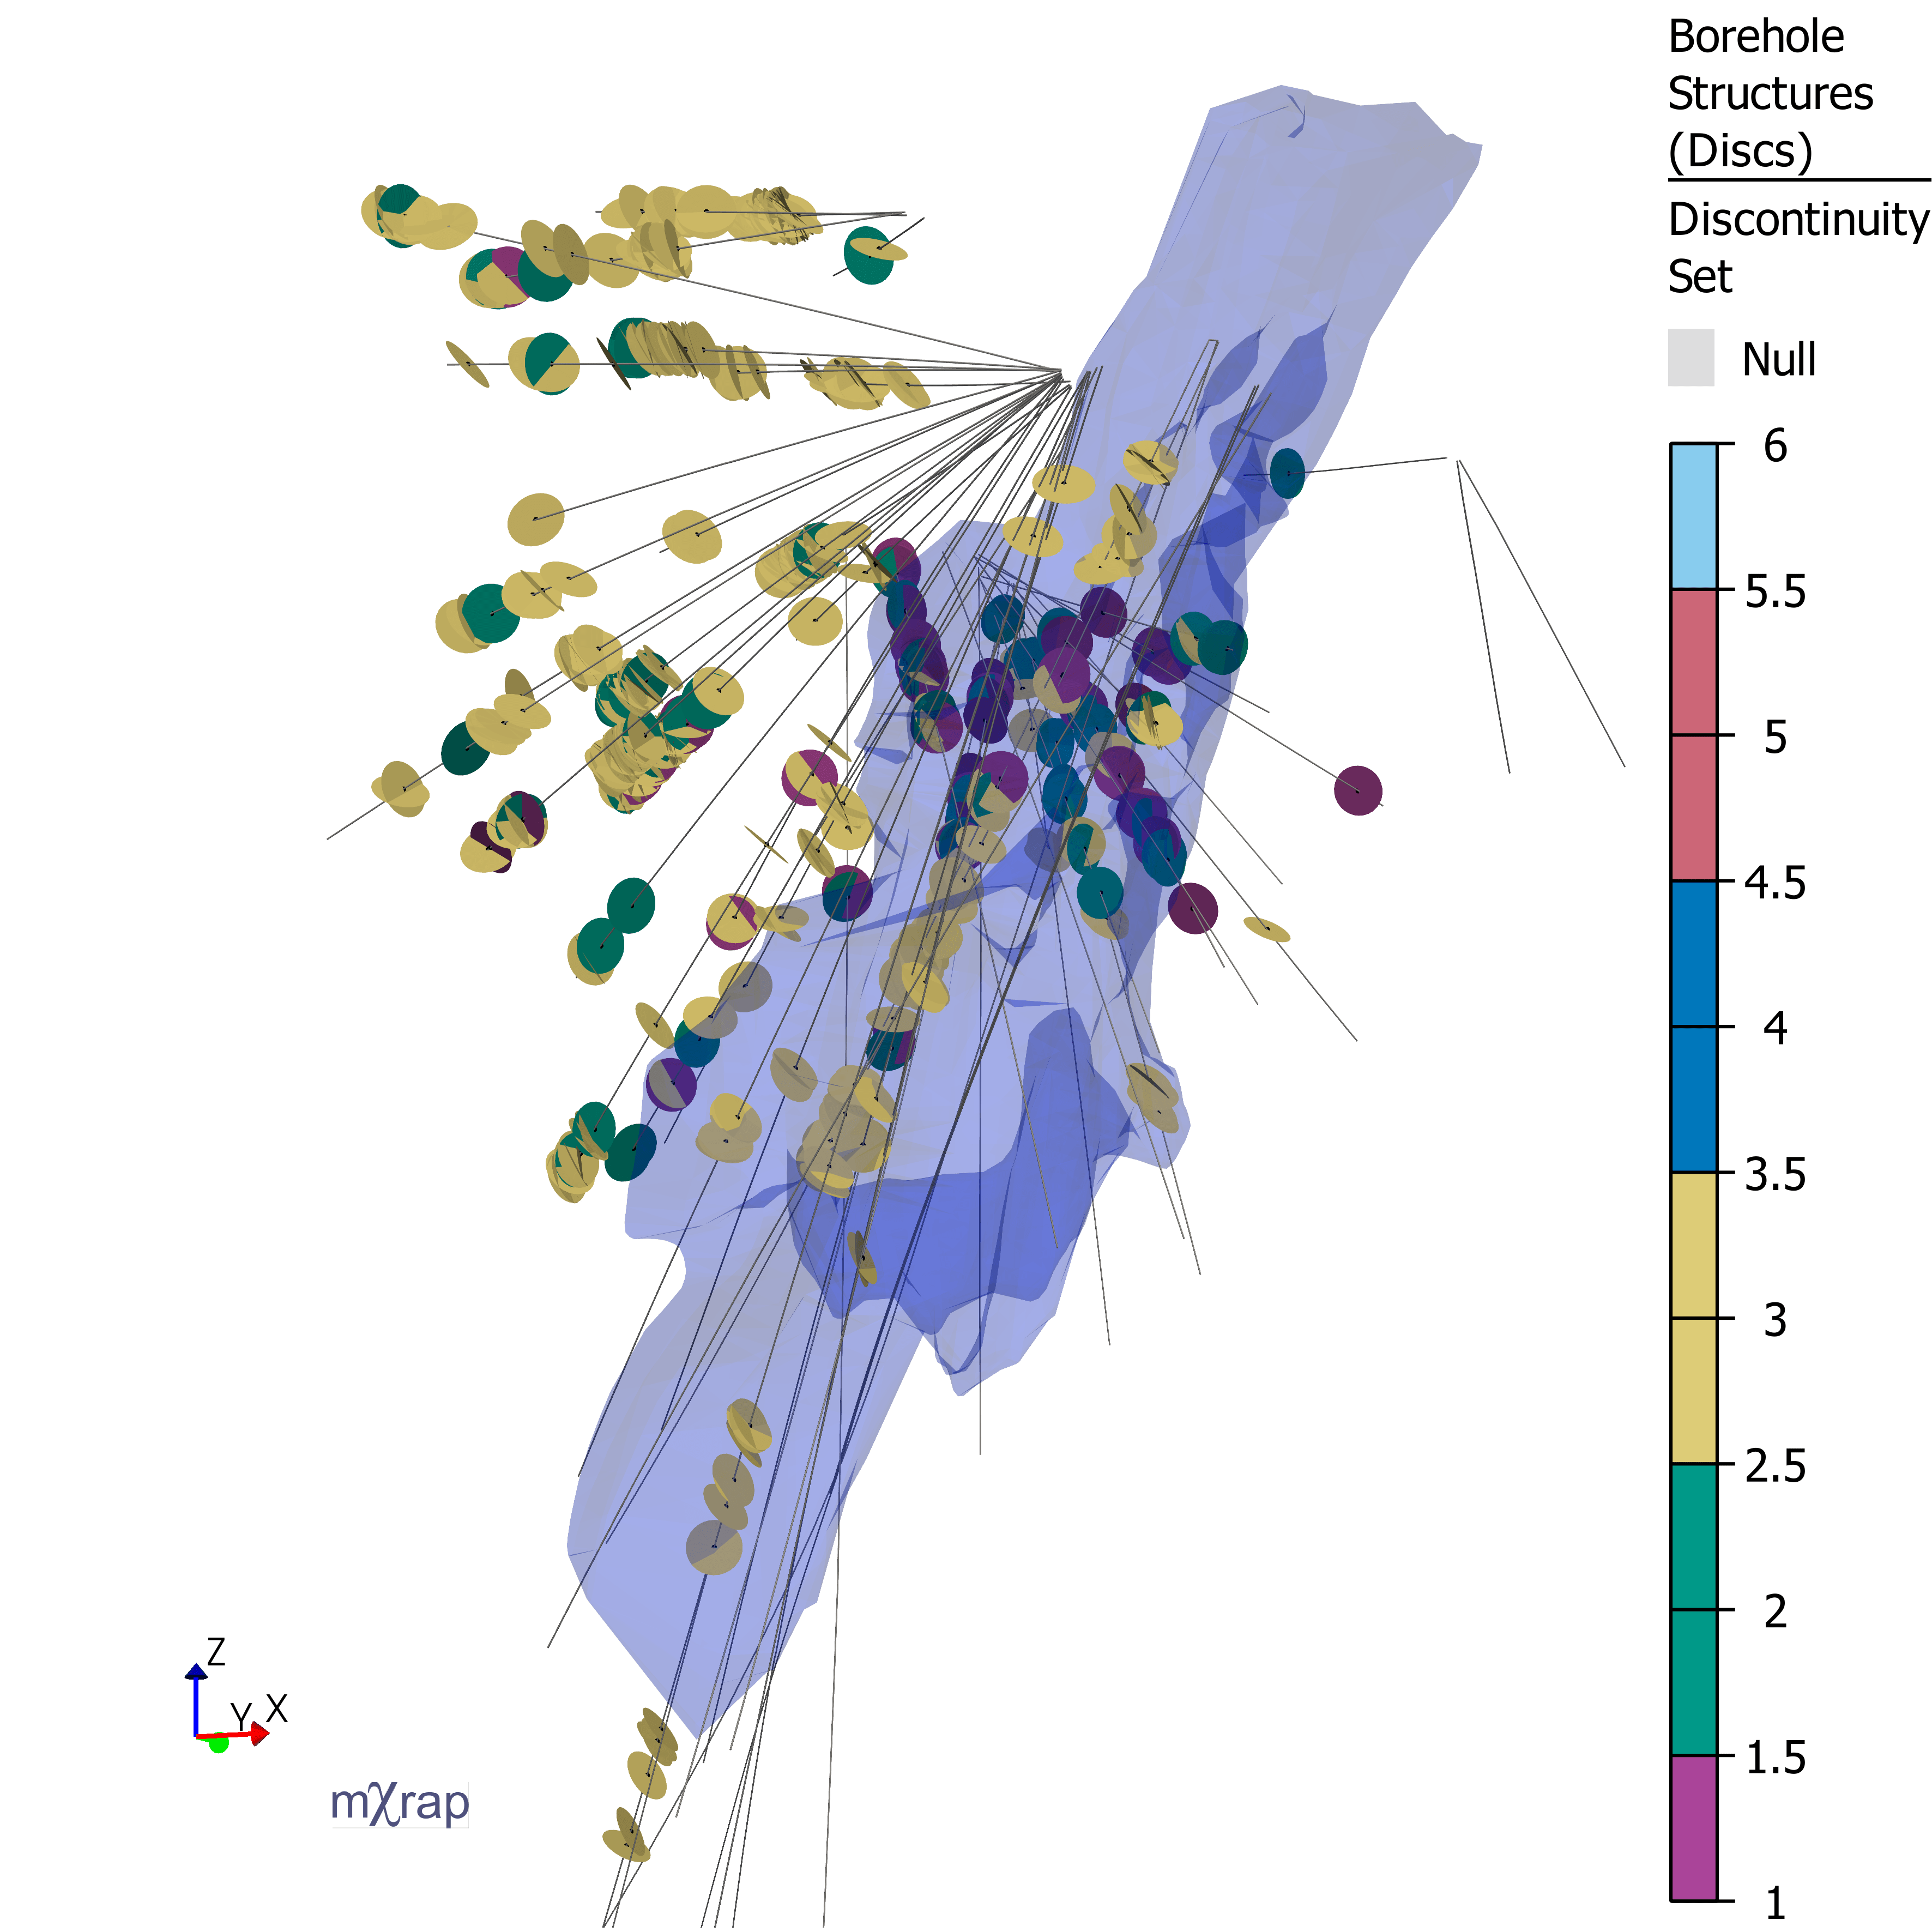
Import and visualise both scanline mapping data and borehole structural logs in 3D and on stereonets. Features include:
- Discontinuity set assignment on stereonets
- Real-time updates to discontinuity set statistics as sets are assigned or filters applied
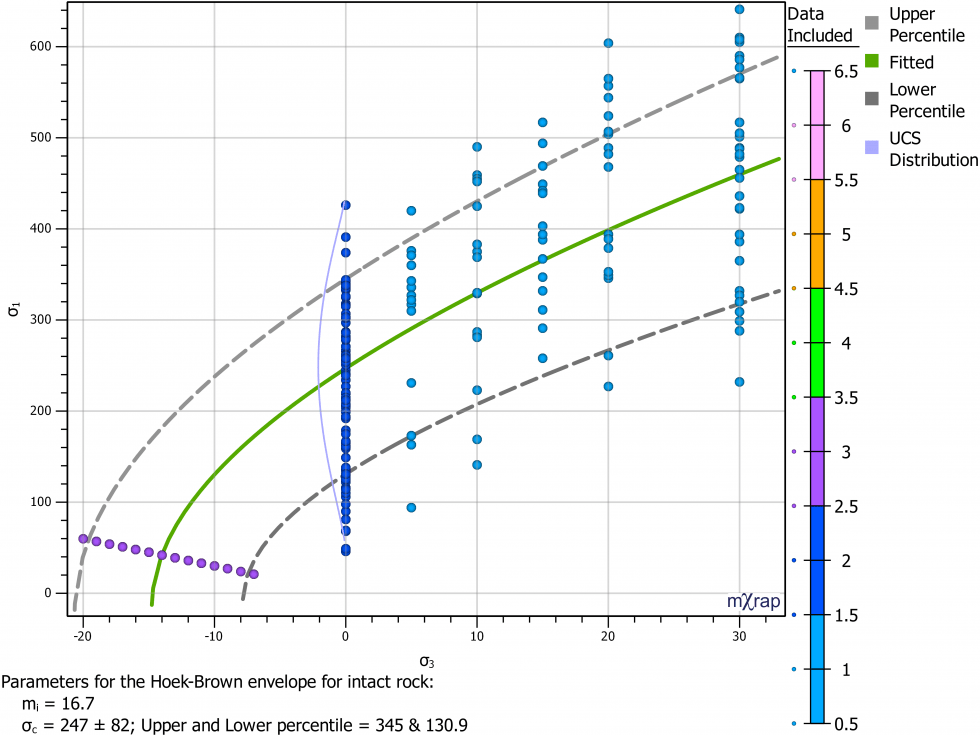
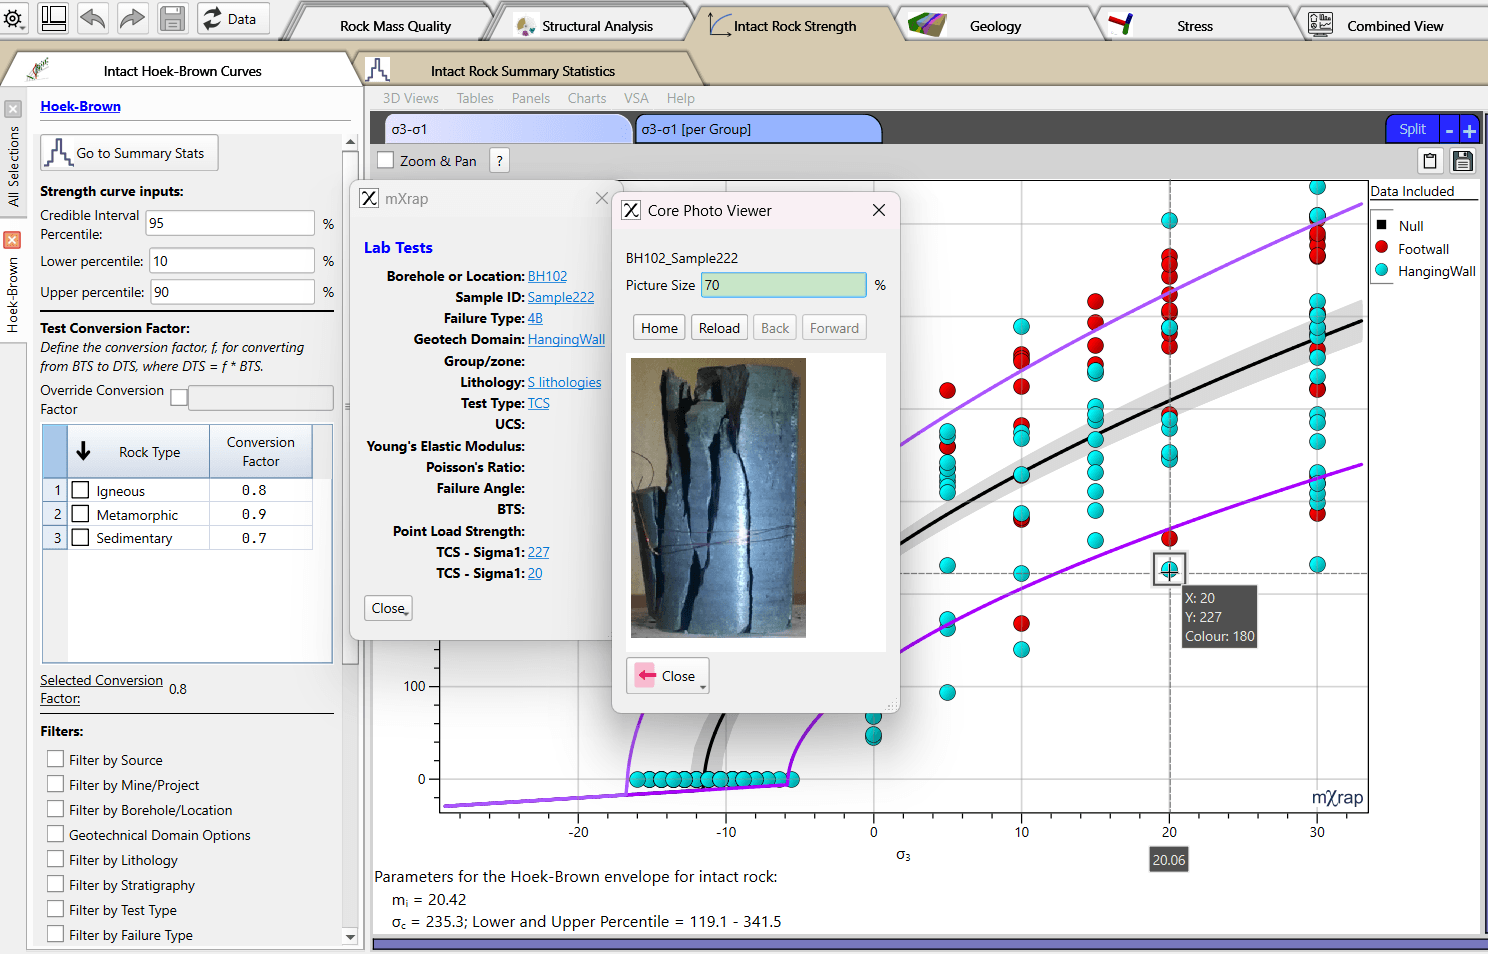
Laboratory Test Analysis
Visualise intact strength laboratory test results along boreholes and generate Hoek-Brown failure envelopes for specific lithologies, data groups, or boreholes.
Integration and Future Development
Current Integrations
- mXrap's Discrete Fracture Network (DFN) generation app
- Data collection web app for efficient tablet-based scanline mapping
Planned Features
- Geotechnical and structural domain creation and analysis
- Window mapping and point load test data analysis
- Integration with mXrap's seismic suite for combined visualisation
- Feeder functionality for stope reconciliation and geotechnical block model applications
Demo
📄️ Geotechnical Domains Delimiter
This app allows you to create your own geotechnical domains; either from boundaries (e.g. lithological contacts or fault planes) or volumes (e.g. lithologies, domains, selection boxes).
📄️ Rock Mass Data Analyser App
Latest updates to the Rock Mass Data Analyser (RMDA) application including interface improvements, new geology and structural data import capabilities, stress analysis tools, and enhanced filtering options for geotechnical data analysis in mXrap.
Videos
Authors
Principal author: Denisha Sewnun
Contributing authors: Daniel Cumming-Potvin, Johan Wesseloo, Kyle Woodward
Citation
Sewnun, D, Cumming-Potvin, D, Wesseloo, J & Woodward, KR 2020, mXrap software app, Rock Mass Data Analyser, Australian Centre for Geomechanics, Perth, mxrap.com