Fault productivity analysis
The fault productivity analysis works by accumulating events and blasts onto the faults. The contribution of each event and blast is distance-weighted with an S-curve function similar to the Grid-based Analysis app. The distance is calculated to fault vertices so use the "Detail Level" control if you want to make the distance more accurate (but slow down the calculations). The maximum bandwidth of the weighting function varies between Rmin and Rmax according to the local magnitude of the event and the tonnage of the blast. The user can set the variables that describe the bandwidth function.

Parameters
Once the events and blasts have been accumulated onto the faults, the mean seismicity-to-blasting relationship can be defined. You can choose which seismic and blasting parameters to use for the relationship.
Seismic parameters
- Cumulative number of events
- Cumulative seismic energy
- Cumulative seismic moment
- Cumulative seismic displacement
Blasting parameters
- Cumulative number of blasts
- Cumulative blast tonnes
Results
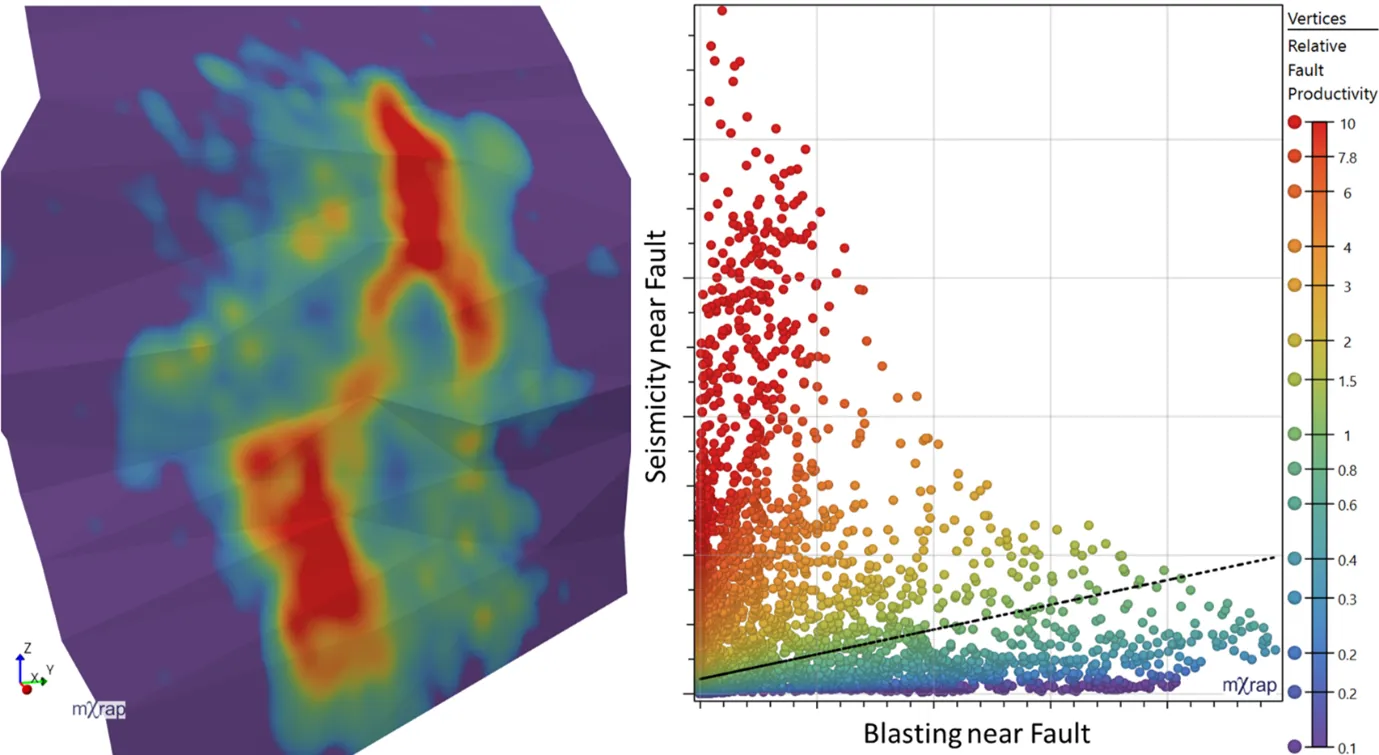
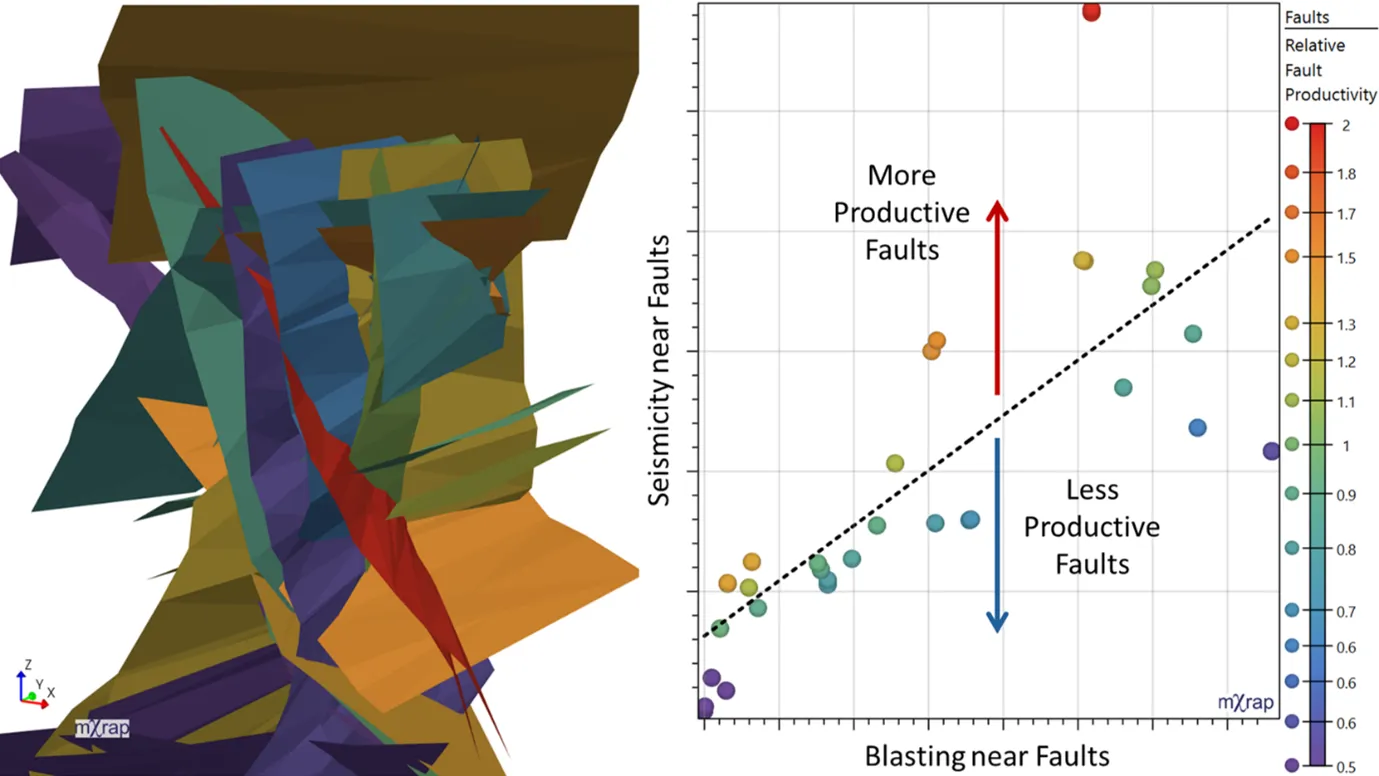
An automative linear relationship is fitted to the seismicity and blasting parameters. You can override the automatic fit parameters with your own relationship. The relative fault productivity is defined as the ratio between the observed seismicity and the expected seismicity given the amount of nearby blasting. This is similar to the 'energy index' idea for seismicity. The relative productivity for each fault can be viewed in the 3D window or viewed in the table summary of faults.
Another option is to look at the variation of productivity across an individual fault. A separate seismicity-to-blasting relationship is defined for fault vertices. This should highlight where on the fault the productivity is highest.