Large Event Analysis
Analysing seismicity around large events
The large event analysis app takes a similar approach to the Short-term Response Analysis app, whereby events are assigned to large events based on a spheroid volume and a time range before and after the large event.
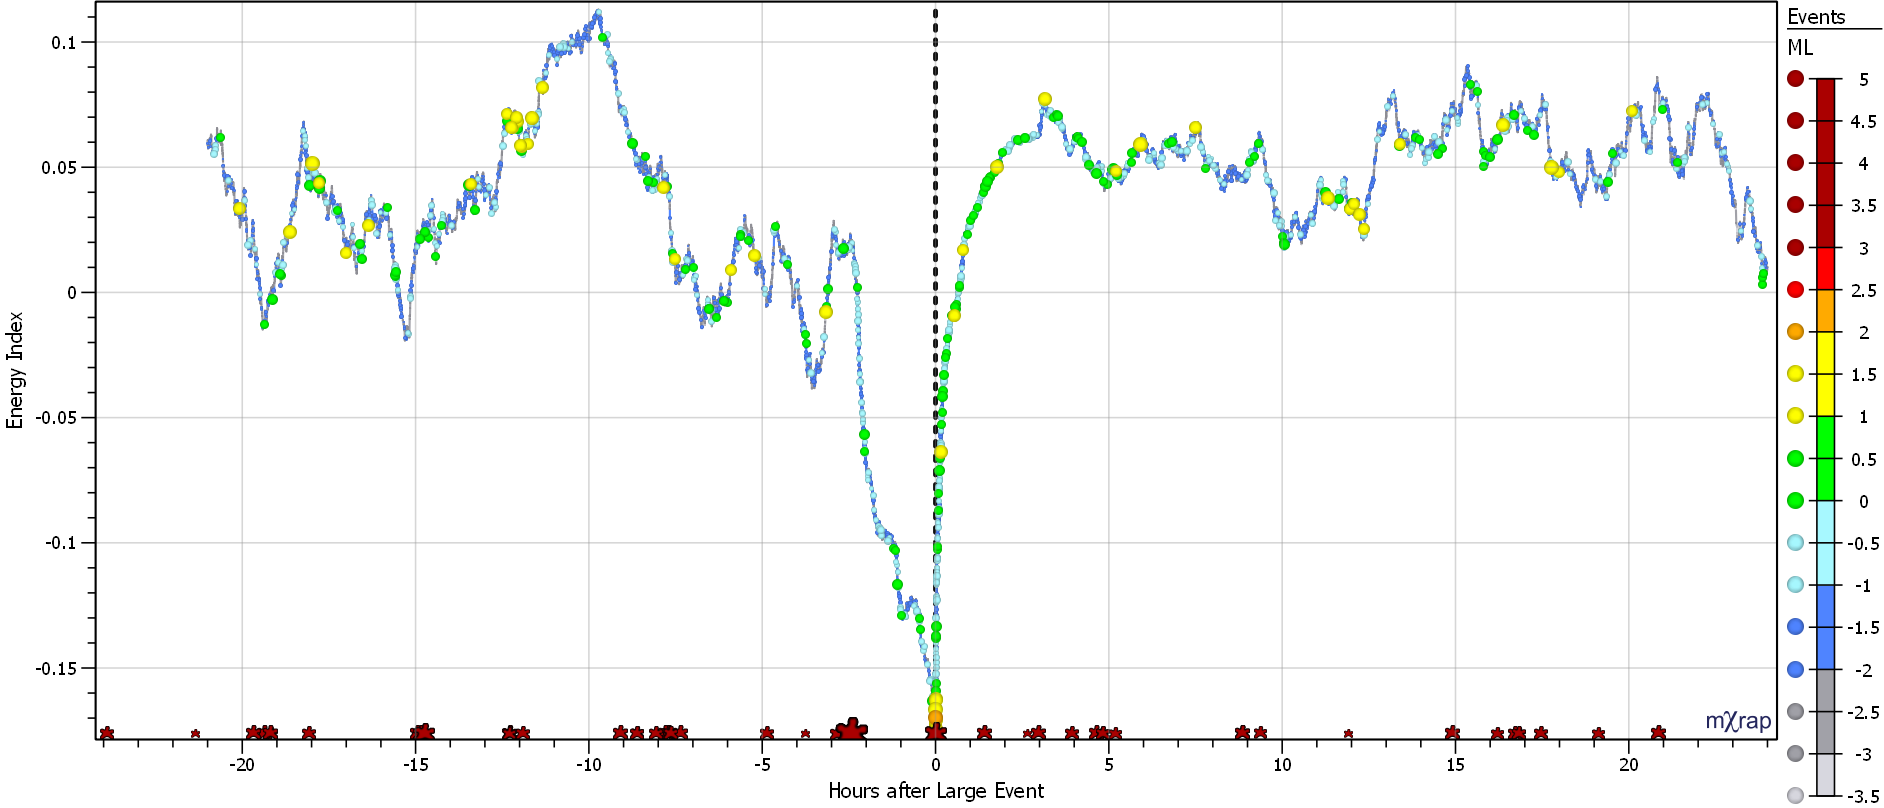
The chart below shows the energy index of seismicity for 24 hours before and after 156 large events. The time of the large event is indicated by a vertical, dotted black line. If a large event had a blast or another large event in the previous two hours, it was not included. The time of the most recent blast and large event, within the spheroid volume, is listed in the table to be excluded from the analysis if required.
There are other chart options available to show individual large events (rather than stacked) or to show different seismic parameters (other than energy index):
-
- Cumulative number of events
- Cumulative seismic moment
- Cumulative apparent volume
- Activity rate
- Apparent stress frequency
- b-value
- Cumulative number of events
You can also copy the current seismic events filter into the general analysis window to use the full range of charts and tools.
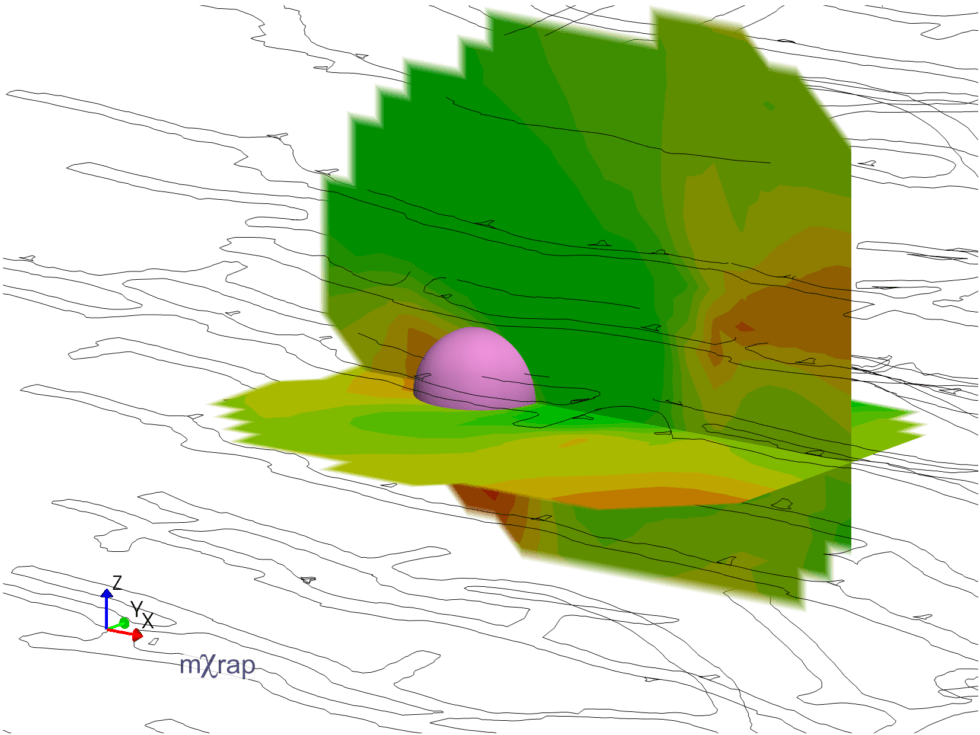
The Large Event Analysis app has receieved a number of upgrades recently. These upgrades focus on analysing seismicity in the immediate time before/after a large event. A new window, called 'plane based analysis', allows the user to investigate the source parameters around the location of an event before/after it occurred.
The analysis conducted is the same as that of the planes in grid based analysis, however the time period is centred around the event time. The planes locations can be copied from the event, so they are centred around the event. The size of the planes can be copied from the event source radius and the plane orientations from the focal planes from the event's moment tensor solution.