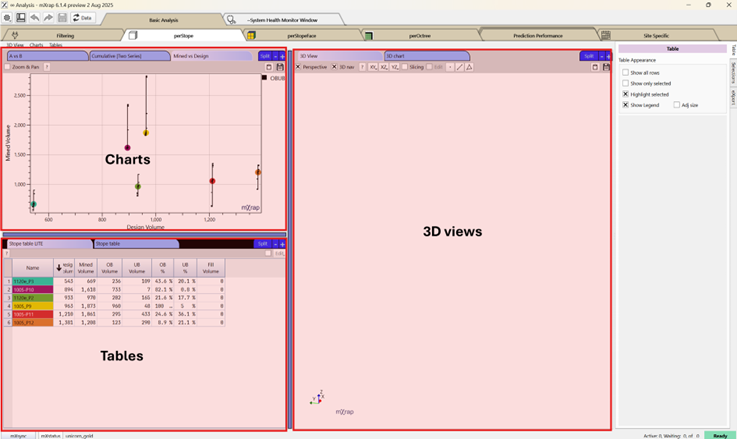
Analysis Windows
There are three analysis windows set for each resolution (stope, face and octree). These windows are all set up the same with the 3D views on the right side, the charts on the top left side and tables on the bottom left side.
Most of the tools used are similar across the three windows. The common tools are explained here.
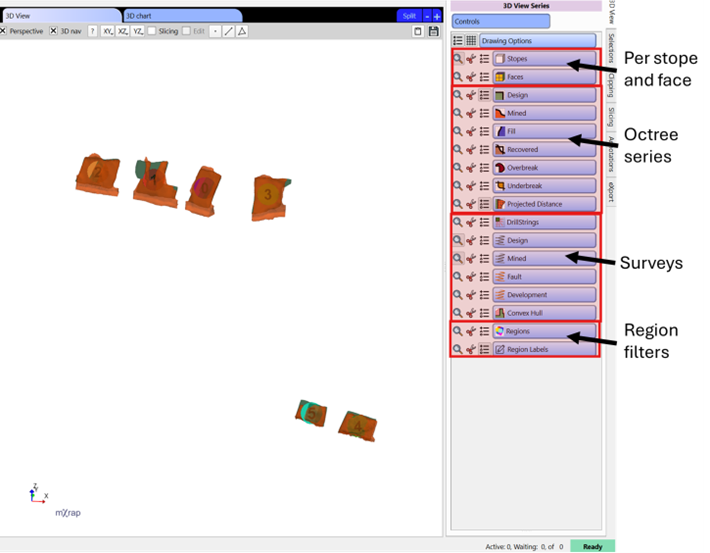
3D View
This tool allows to visualise the data and do spatial interpretation. Series include the octree classified as design, mined, fill, recovered, overbreak, and underbreak along with the projected distance. Surveys associated with each stope include drill strings, design, mined, faults, and development along with the convex hull. Regions can also be plotted. The per stope, per face and per octree (design only) series have various marker styles created form the parameters or stope performance that can be used to visualise and interpretate the data.
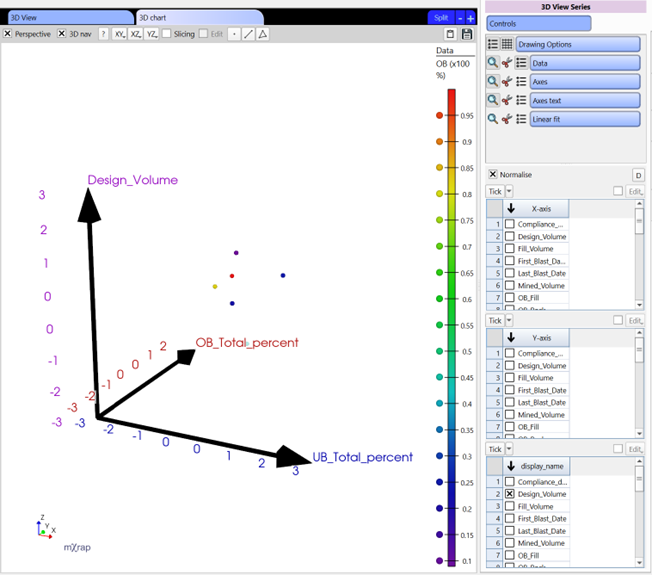
3D Chart
This chart can be used to identify trends in the data. Root causes of stope performance can be complex and this chart will help interpretate that data using that additional dimension.
Use the marker style to add additional information to your analysis.
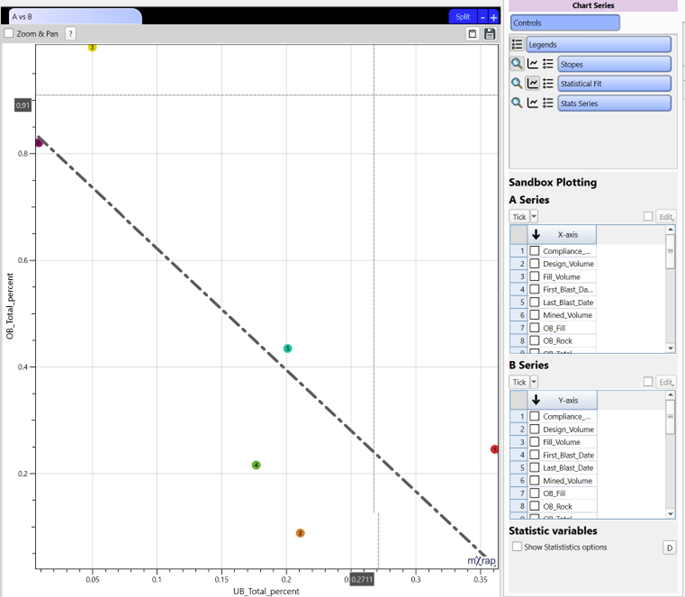
A vs B Charts
These bi-variate chart offer flexibility, allowing to select your X and Y axis parameters. Statistical fits (linear or power scale) can be fitted to help visualise the trend. A stat series can also be visualised where different option can be selected at the bottom of the series panel by ticking on the statistical variables option. These charts are available per stope and per face.
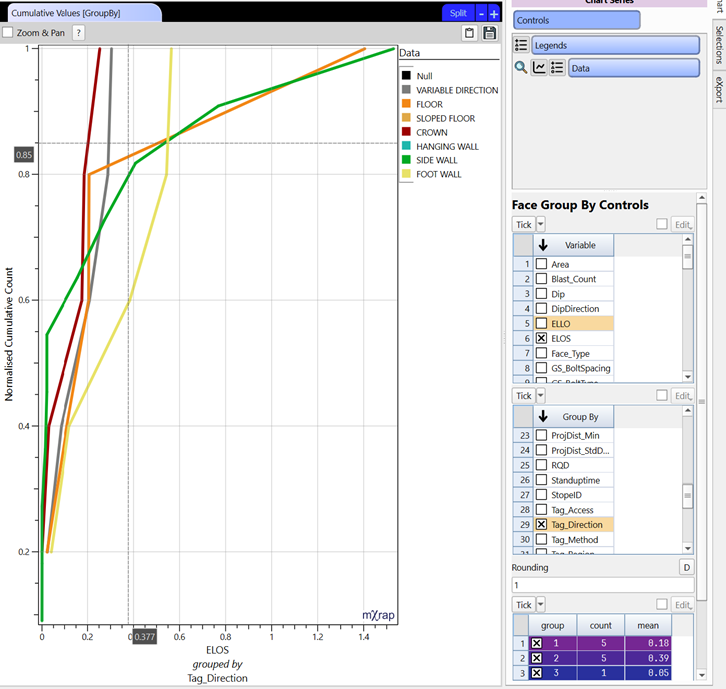
Cumulative Charts
These charts allow to analyse the distribution of the selected parameter and can be compared with other parameters depending on which chart you are using. You will find the standard option, log, two series (for comparing two parameters) and group by (for comparing different groups with in a parameter).
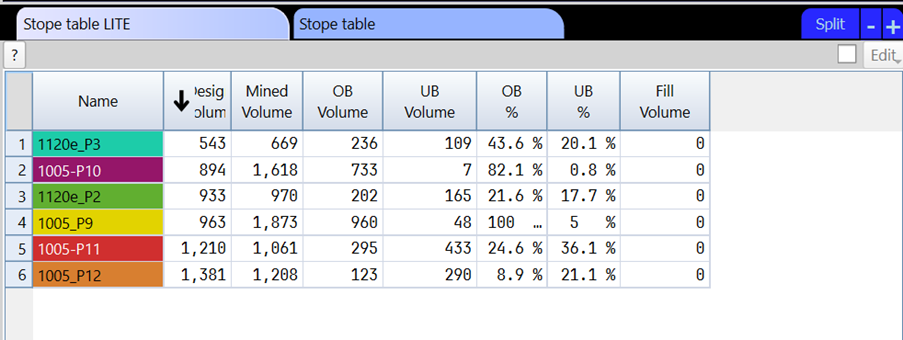
Tables
These will list the stope, faces or octree based on the initial filtering with their different parameters and stope performance. There is a regular format that holds all the columns and a LITE format which holds only the essential information for easier read. These tables can be exported.