Per-Face Analysis
Purpose
Assessment of performance on a per face basis. This analysis used to identify trends unique to specific stope faces, for example, Stability Chart analysis or a comparative assessment overbreak of hanging wall faces with and without ground support.
Analysis options consist of:
- 3D view
- Tables (regular and LITE version)
- Charts:
- A vs B Chart
- 3D Chart
- Cumulative Chart (Group By)
- Cumulative Log Chart (Group By)
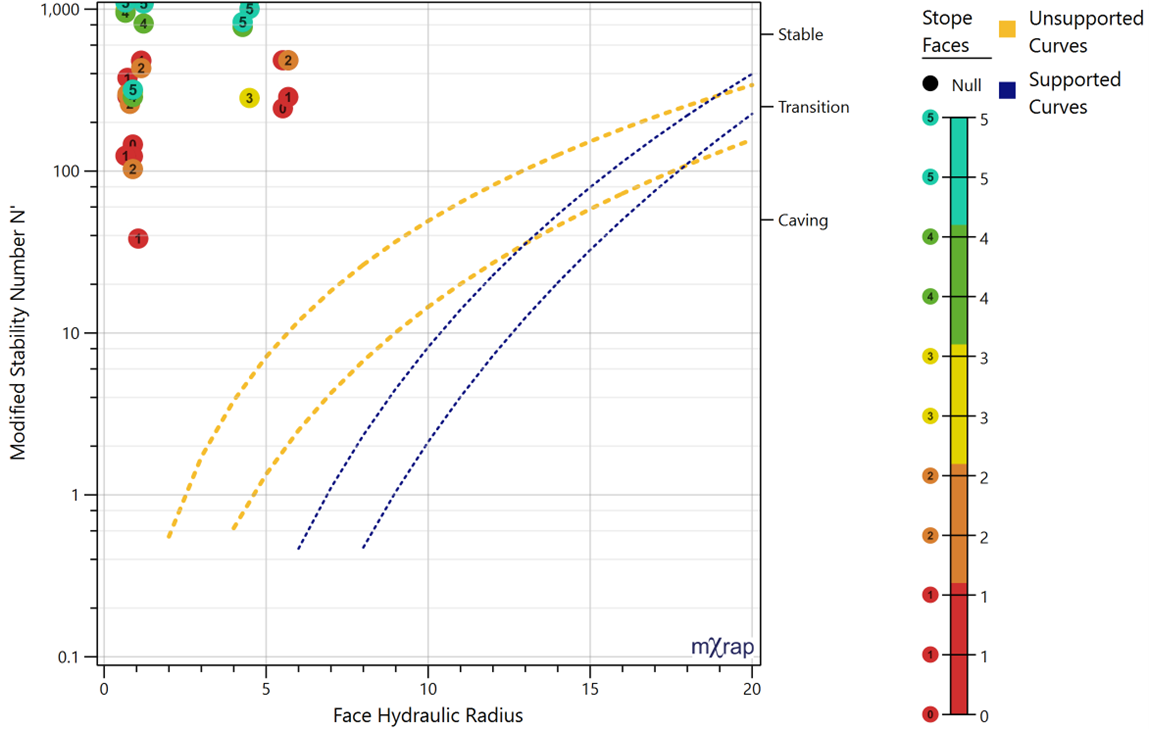
- The Stability Chart
- Plots the Stability Number and the Hydraulic Radius of a face. The chart also includes standard design curves while also allowing site specific curves to be entered.
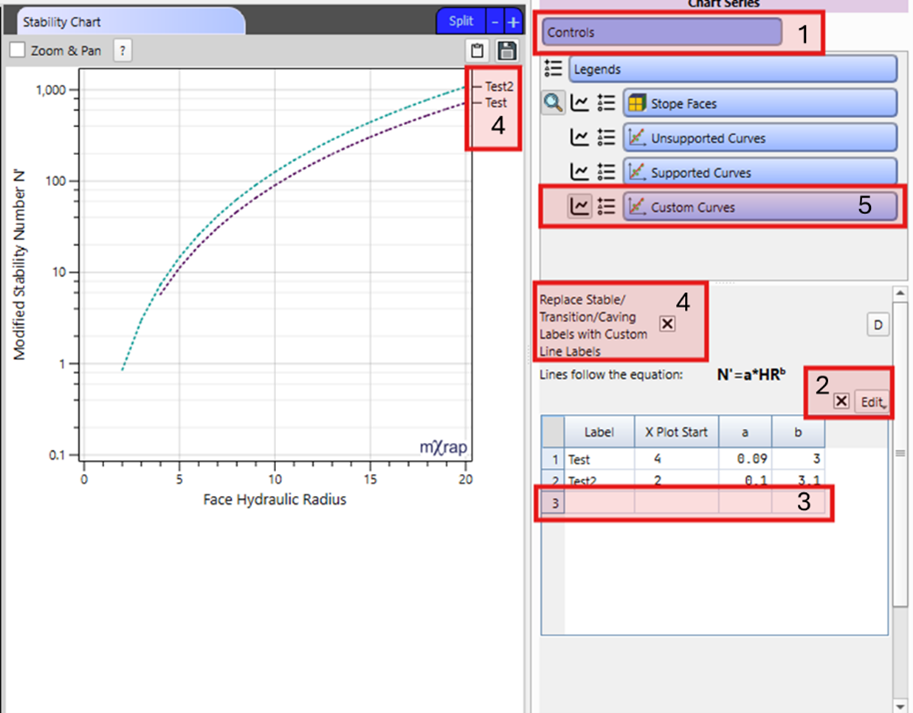
- To create custom curves:
- Step 1. Go into the control panel
- Step 2. Tick the Edit box and insert a row
- Step 3. Input the information for the new curve
- Step 4. Tick the option to show the custom labels
- Step 5. Finally tick on the Custom Curves series to see them
At a per face resolution, a greater variety of parameters can be queried and are listed here:
- Face geometry (Area, perimeter, Hydraulic radius, Dip, Dip direction, planarity, Max ERF)
- Tags (Face type, Ground support tags, Stope tags)
- Geomechanical parameters (Ja, Jn, Jr, RQD, UCS, Q', N')
- Stand-up time (days)
- Position (X,Y,Z)
- Number of blast
- First blast date
- Stope performance
- OB (ELOS, rock, fill, max and mean distance)
- UB (ELLO, rock, fill, max and mean distance)
- Projected distance (min, mean, StdDev, max)
Video
Explains the Per Face window layout and tools in the stope reconciliation Analysis App.